

Web App • Carbon Accounting • B2B
App sneak peek.
What I worked on
Team Leadership
Product Strategy
Product Design
User Experience
User Research
Client
Ecologi
Agency
True to Form
Ecologi Zero is a web tool designed to help small businesses calculate their carbon footprint, simply by connecting their financial accounting software.
The team and I designed an entirely new web app, from research, concepts, design, testing, all the way to production-ready designs for the launch of the beta version.
Overview
01 of 05 .
Video tour of Ecologi Zero.
⦿ Use the video player to zoom in.

TL;DR
With Ecologi Zero, users can:
Import financial transactions and calculate the carbon footprint of their value chain.
Calculate the impact of their business energy usage and travel.
Compare and review emission hot-spots to make tangible changes.
ACHIEVEMENTS
Project duration
9 months
from concept to Beta
User acquisition
1000+ sign-ups
in the first year from launch
☆ Updated on 5 May 2024
Challenge
02 of 05 .

CHALLENGE
Carbon accounting is mainly for larger businesses that can afford specialised consultants ...
While small businesses are not required to produce annual emission reports, many want to assess their impact voluntarily, for example, to achieve B-Corp status.

SOLUTION
... so we created a scalable tool that allows small businesses to calculate their carbon footprint directly from their financial transactions.
Small businesses often don’t have dedicated internal resources to look after carbon accounting so leveraging existing processes and data was crucial.
Setup
03 of 05 .

TEAM & ROLE
A cross-functional task force
My role in the team was:
Leading the design activities across UI, UX and research.
Executing key UX, research and design tasks.
Coordinating with the engineering team and the senior management.
DESIGN TEAM
➸ Lead Product Designer (me)
・ User Researcher
・ UI Designer
EXTENDED TEAM
・ Product Manager
・ Front End Developers ×3
・ Back End Developers ×3
KEY STAKEHOLDERS
・ CEO
・ Head of Science
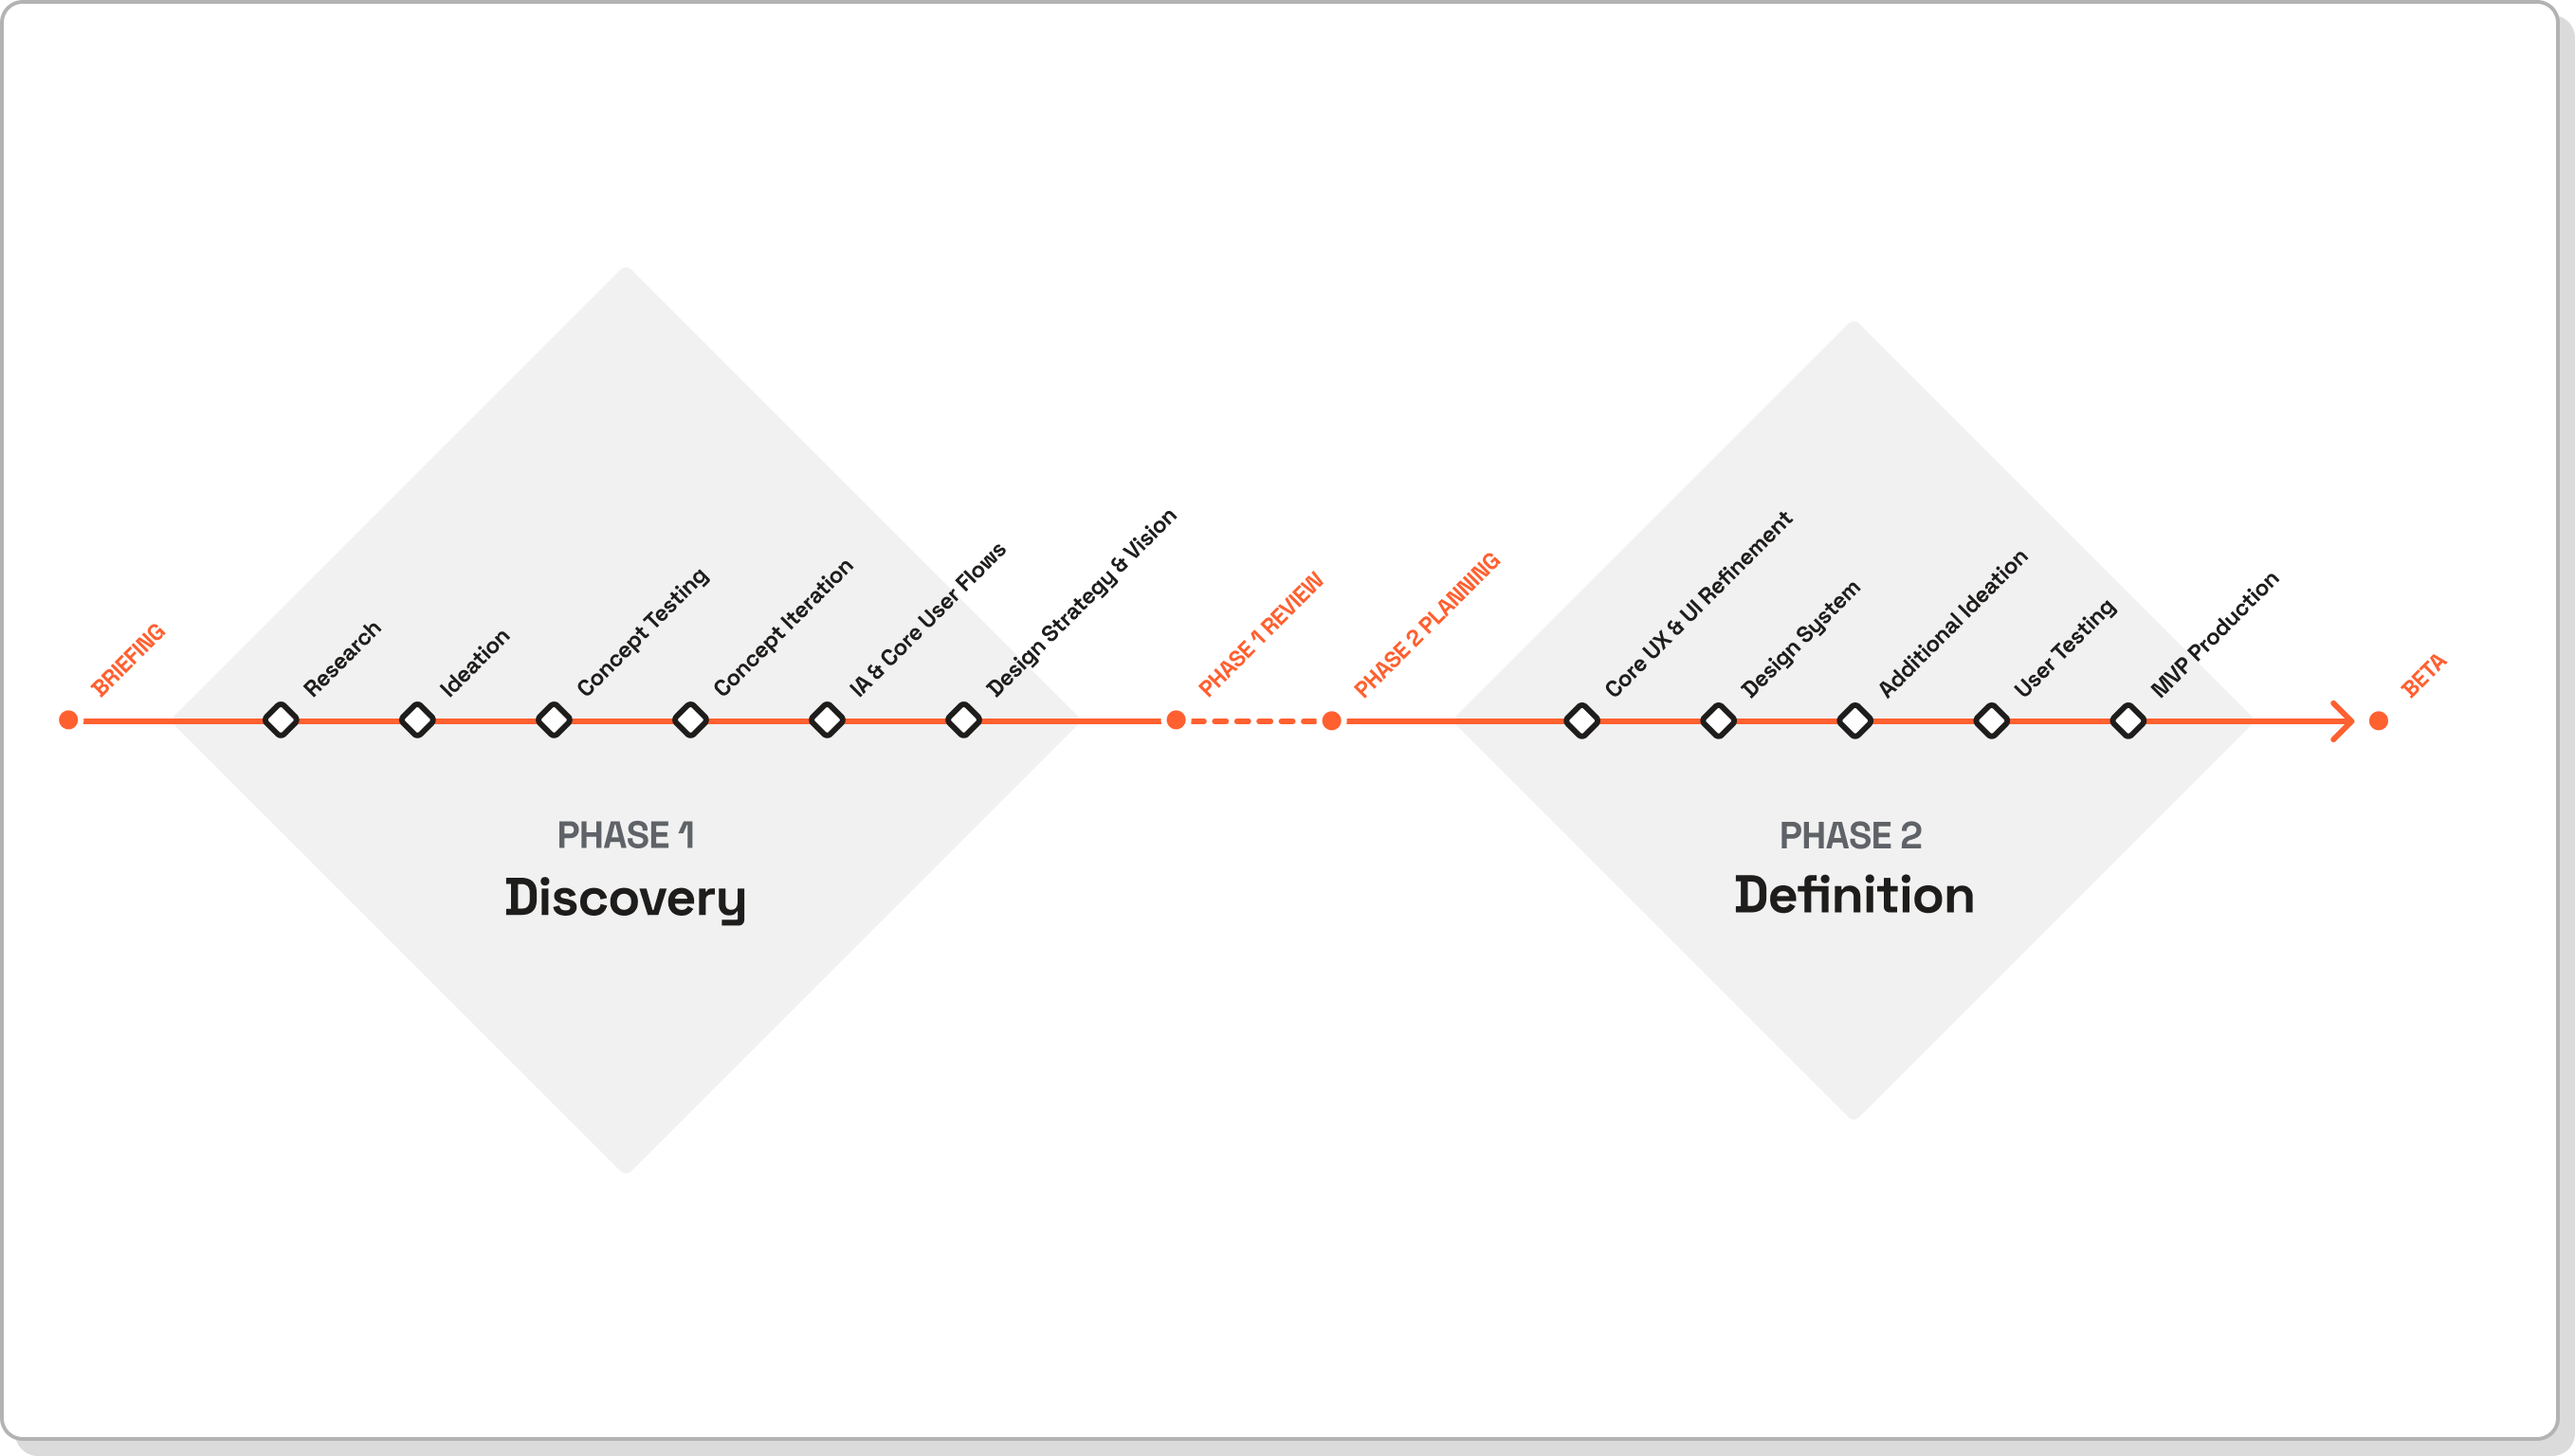
Key project milestones.
⦿ Select the image to zoom in.

TIMELINE
Full speed towards Beta
The project was split into two typical phases of Discovery and Definition with a target release date for the first Beta.
Each phase was divided into two-week sprints with recurring touch-points with senior stakeholders and user testing at regular intervals.
Discovery
04 of 05 .

TARGET AUDIENCE
Leveraging the user base
For the Beta launch, we recruited volunteers within the existing user base for Ecologi’s carbon avoidance and reforestation projects.
The initial target audience consisted of service-based small to medium businesses in the UK.

Starting from Beta.
⦿ Select the image to zoom in.

Examples of early experimentation with metrics and interactions.
⦿ Select an image to zoom in.

IDEATION
Experimenting with complexity
The initial experimentation focused on extracting and displaying the most valuable carbon metrics.
Another key area involved testing different interaction patterns for associating suppliers with their industry emissions.

USER TESTING
Continuous learning
Throughout the project, we conducted multiple rounds of testing with low and high-fidelity prototypes.
At the same time, we distributed several surveys on topics that required a quantitative approach.
Example of a low fidelity prototype tested with users.
⦿ Use the video player to zoom in.
Definition
05 of 05 .
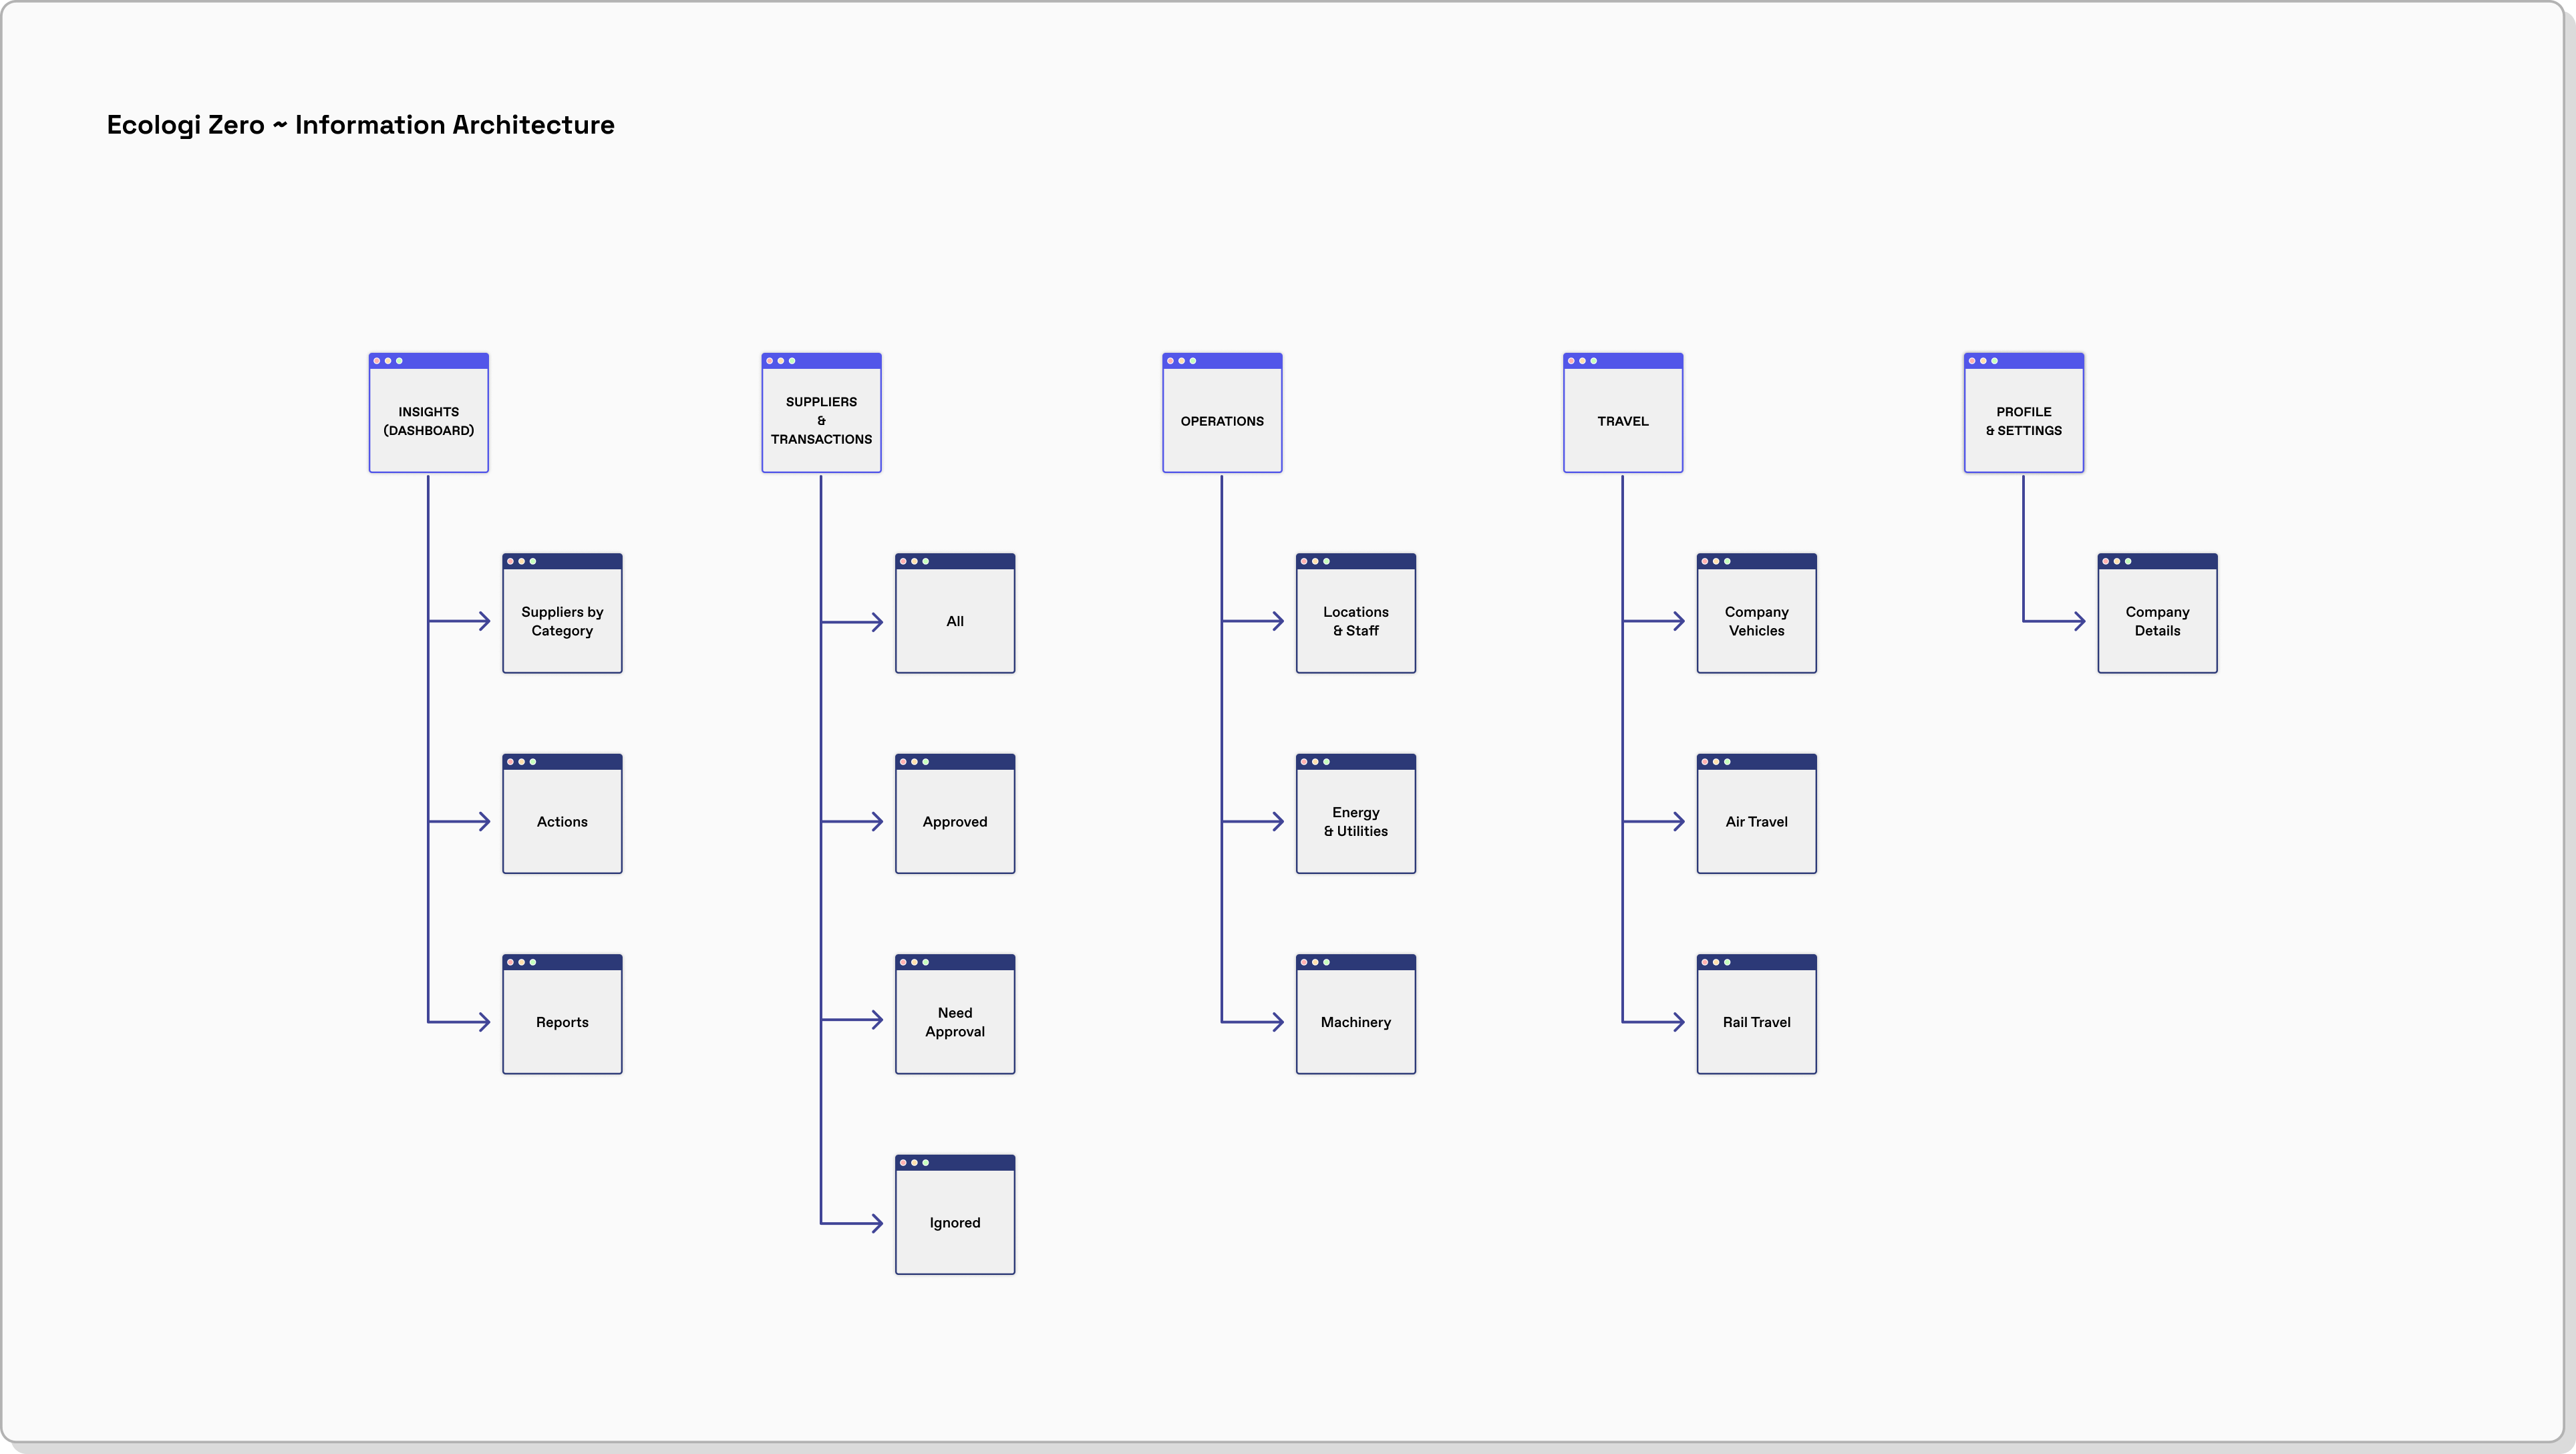
Example of an information architecture diagram.
⦿ Select the image to zoom in.

STRUCTURE
Defining the overall experience
Once a general direction was established, it was time to define the overall experience.
At this stage, we fully defined the information architecture and then developed detailed user flows.

WIREFRAMING
Framing the experience
The user journeys were visualised screen by screen as wireframes.
Particular care was taken in defining the display and interactions with data.
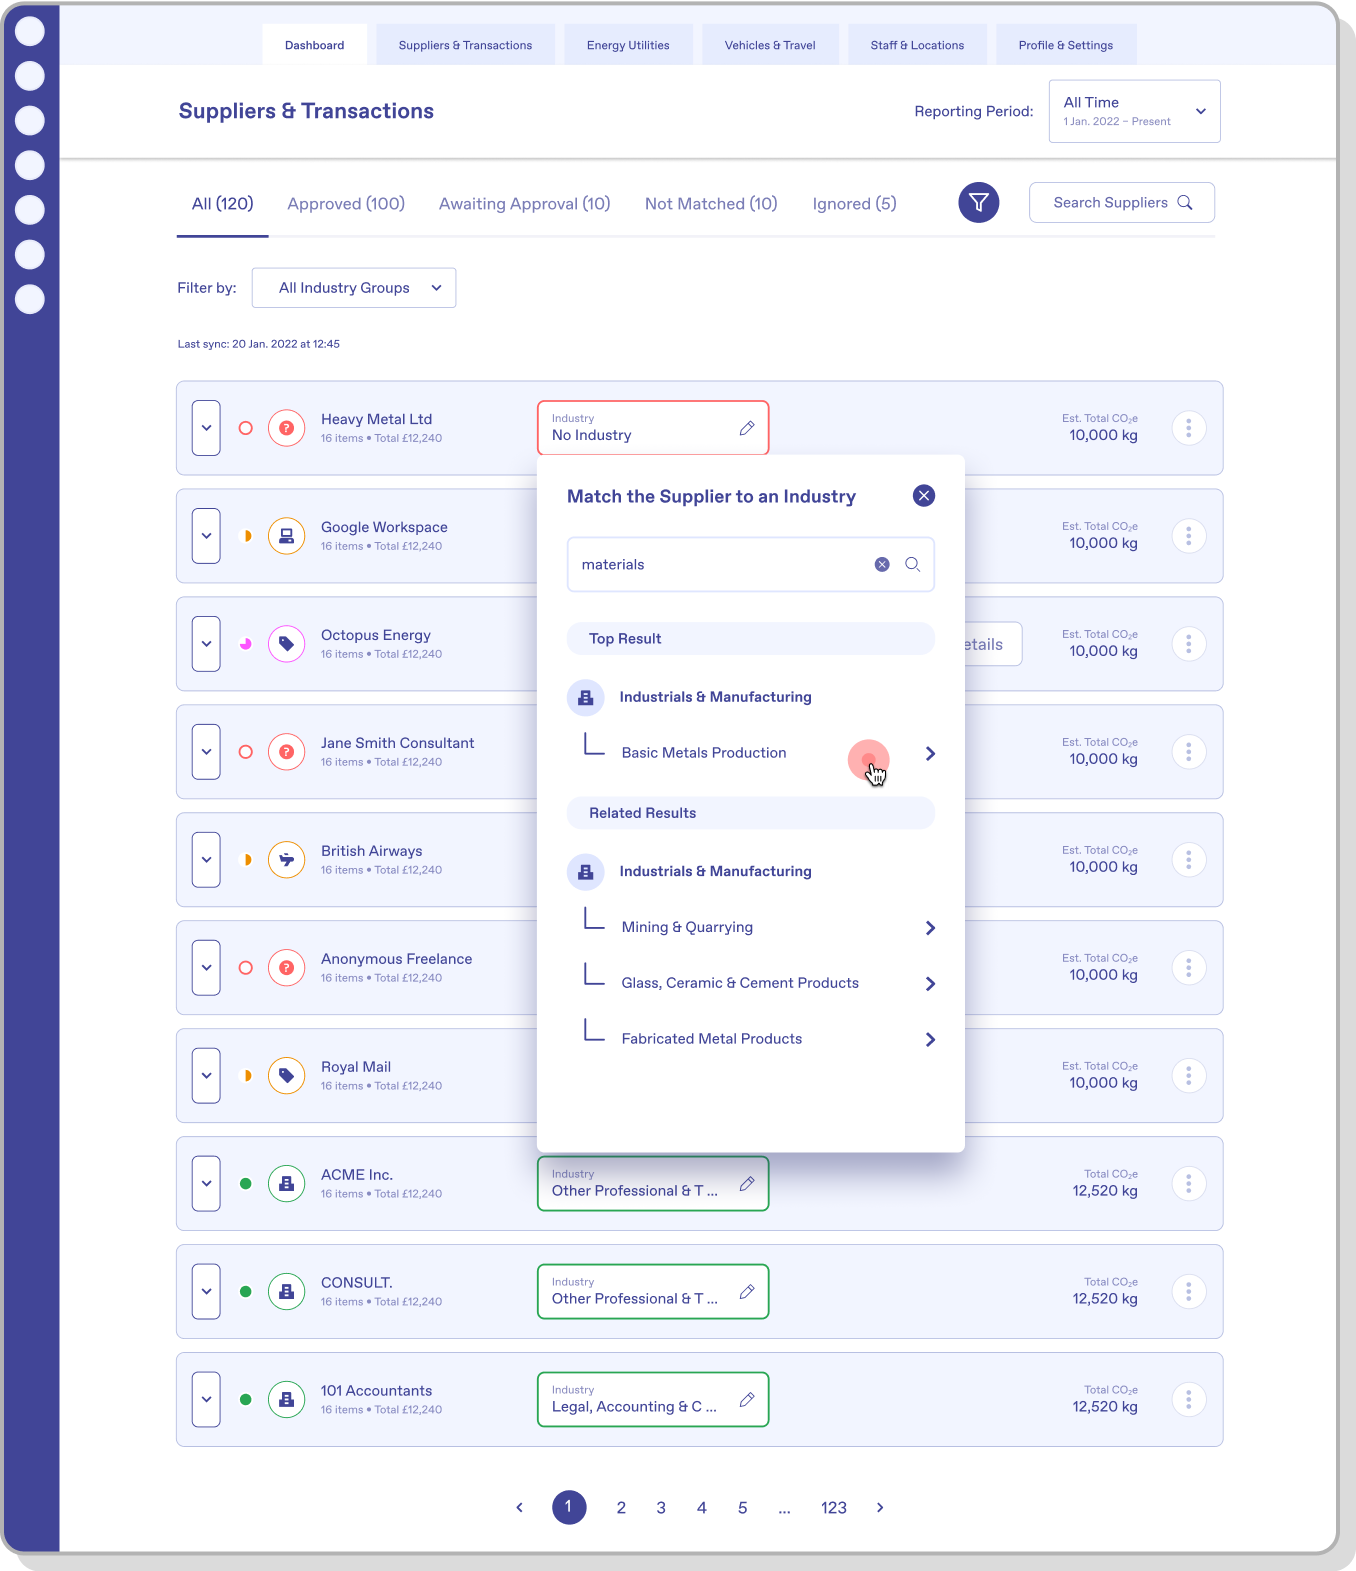
Examples of wireframes from various sections of the app.
⦿ Select an image to zoom in.
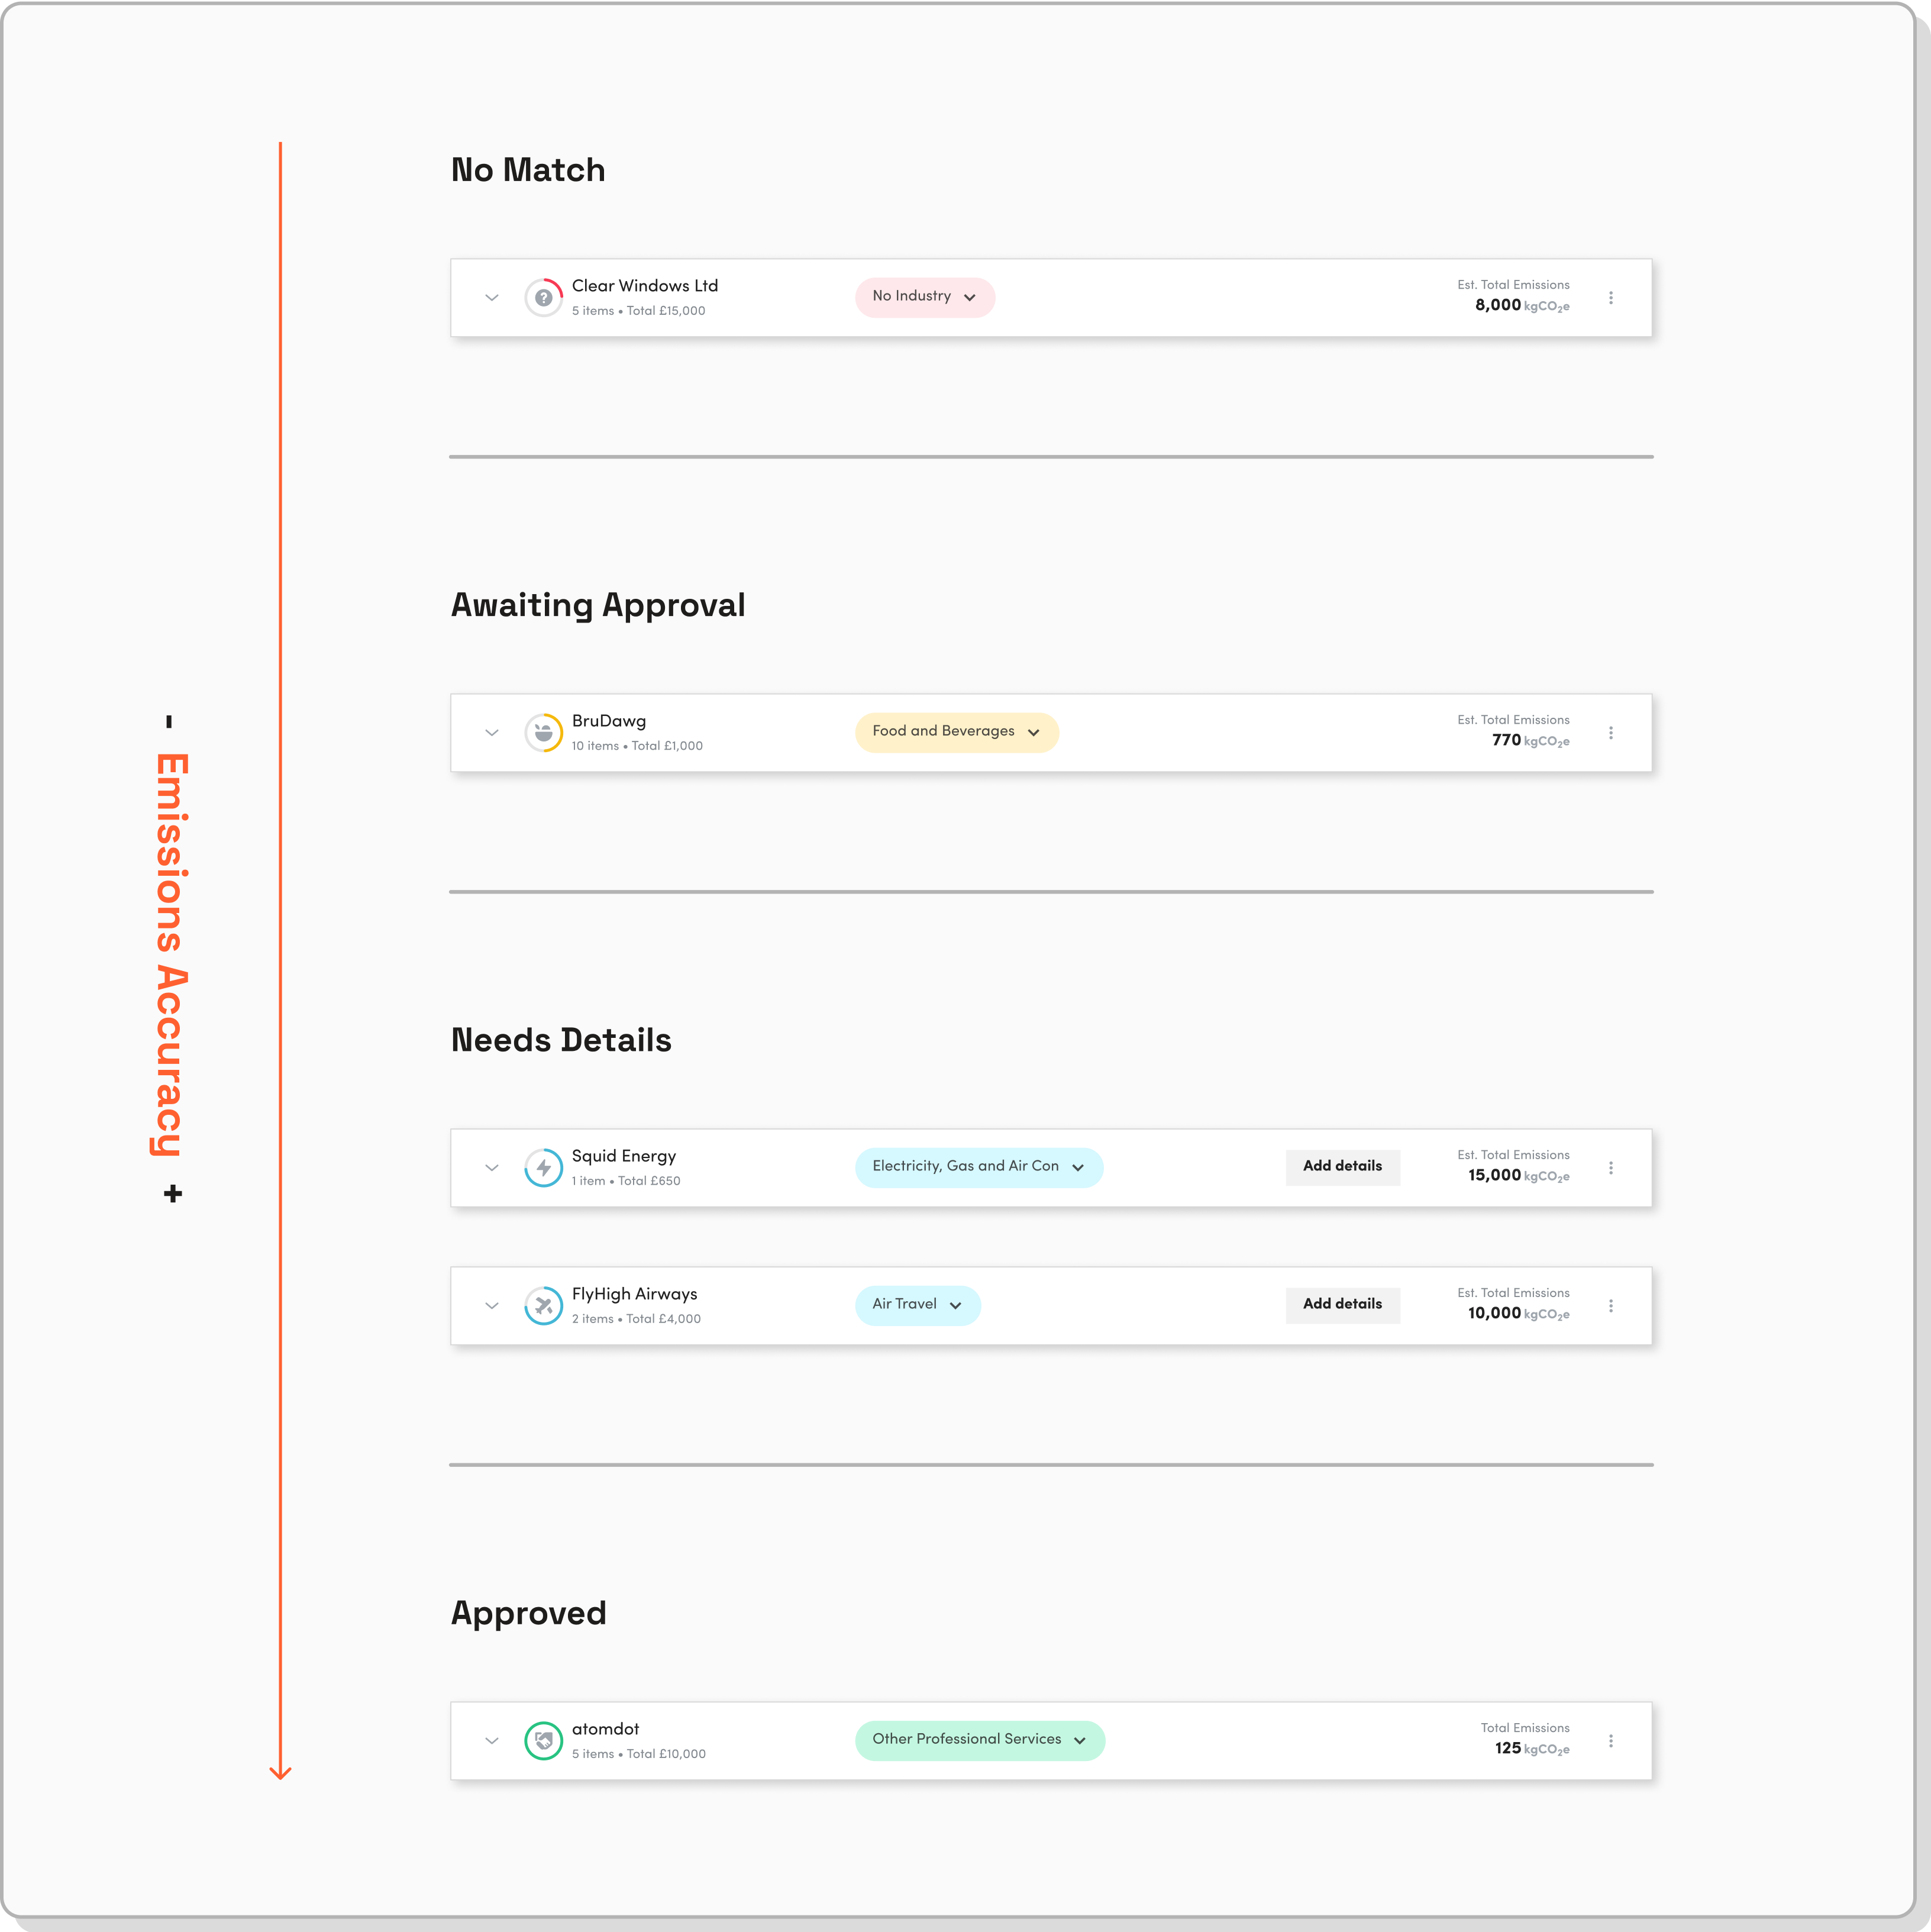
Examples of suppliers states based on the degree of emissions accuracy.
⦿ Select the image to zoom in.

INTERFACE
Finding a good match
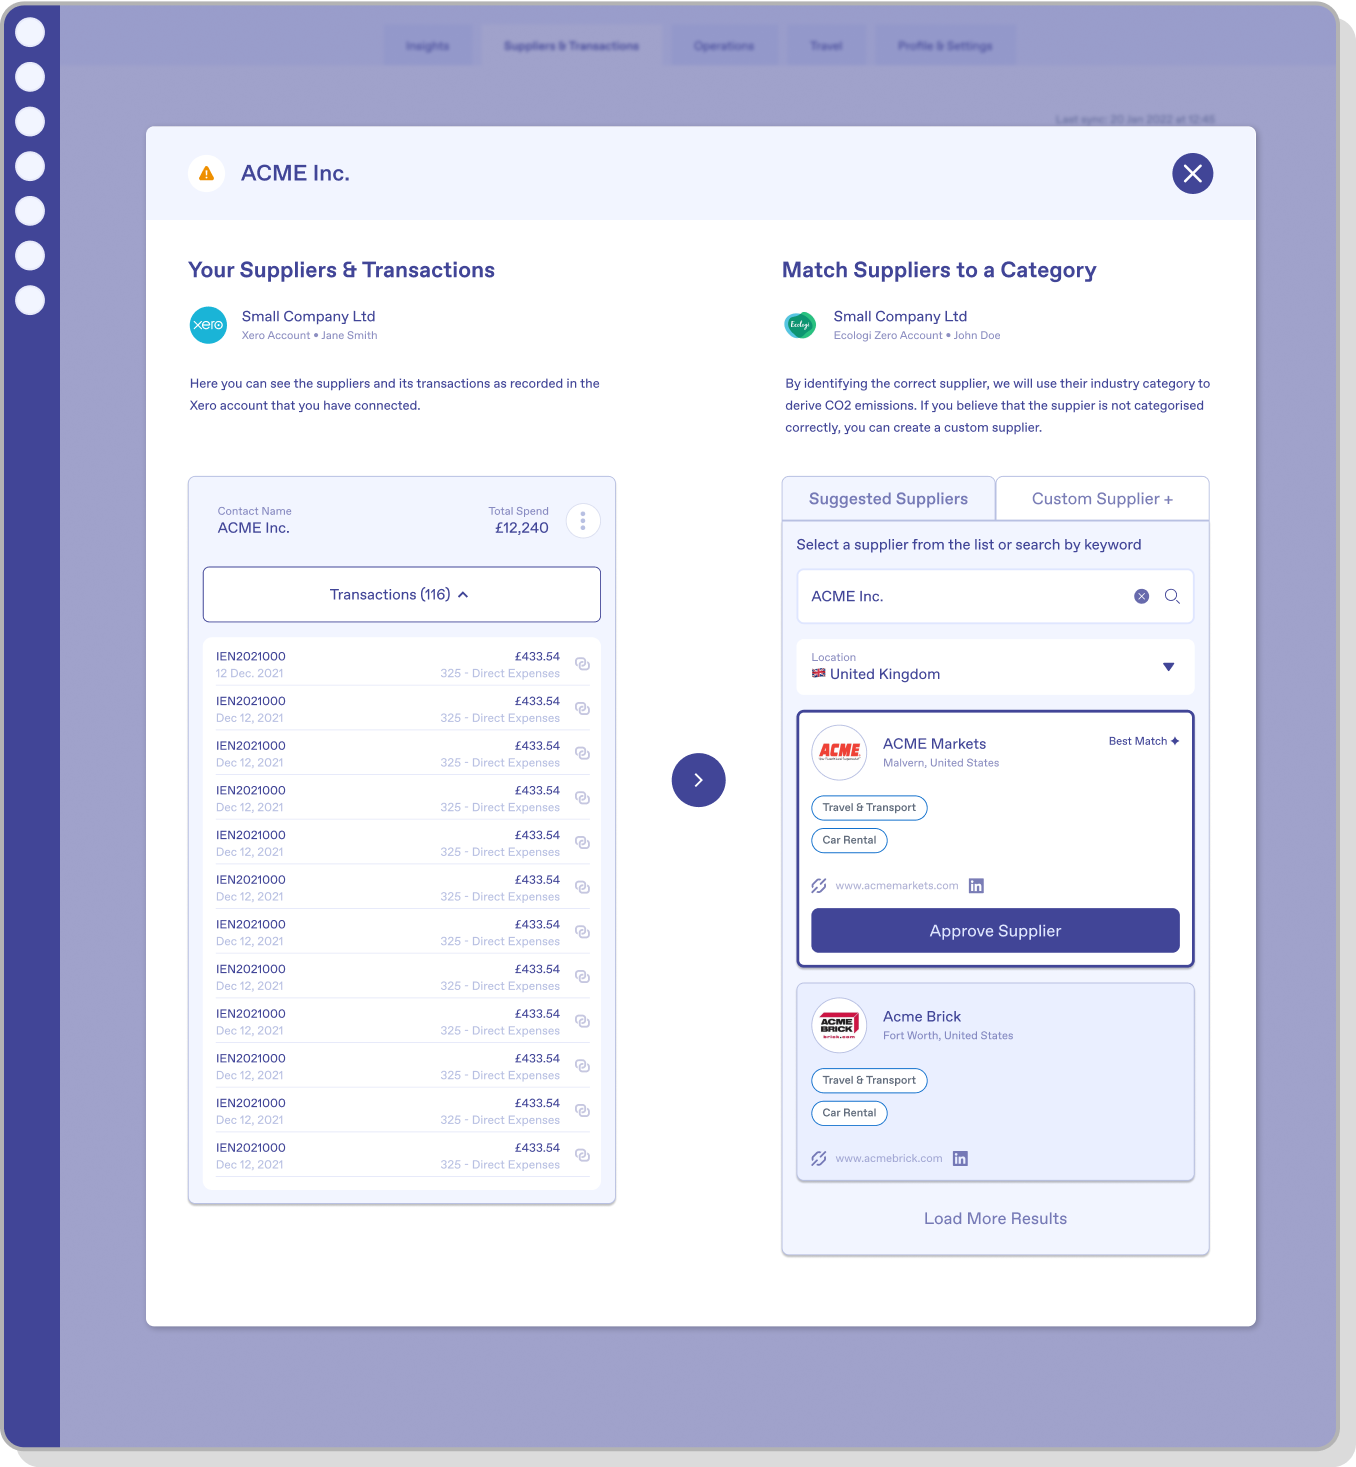
Matching suppliers accurately to their industry and calculating their carbon emissions was the crucial aspect of the product.
For each supplier, we created a visual state that communicated the accuracy of its emissions.
Assigning emissions to suppliers
When suppliers are imported from accounting software, they are automatically assigned an industry and a CO2e value based on the total transactions.
To ensure accuracy, users must approve the suggested industry or manually assign one if confidence is low.
※ Design Challenges
Striking a balance between minimum user input and emissions accuracy.
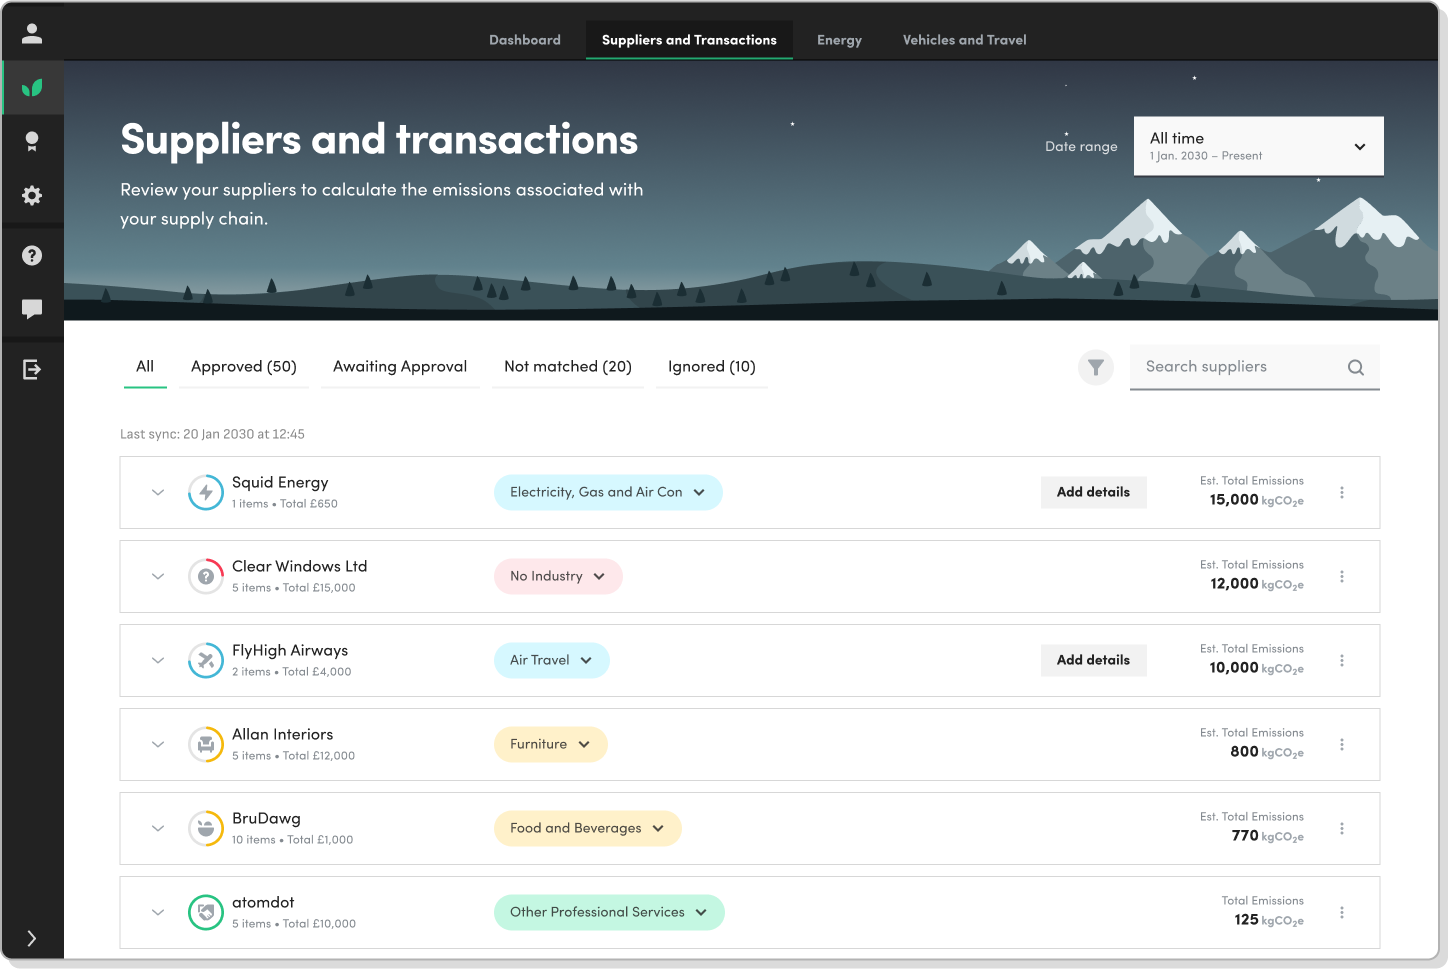
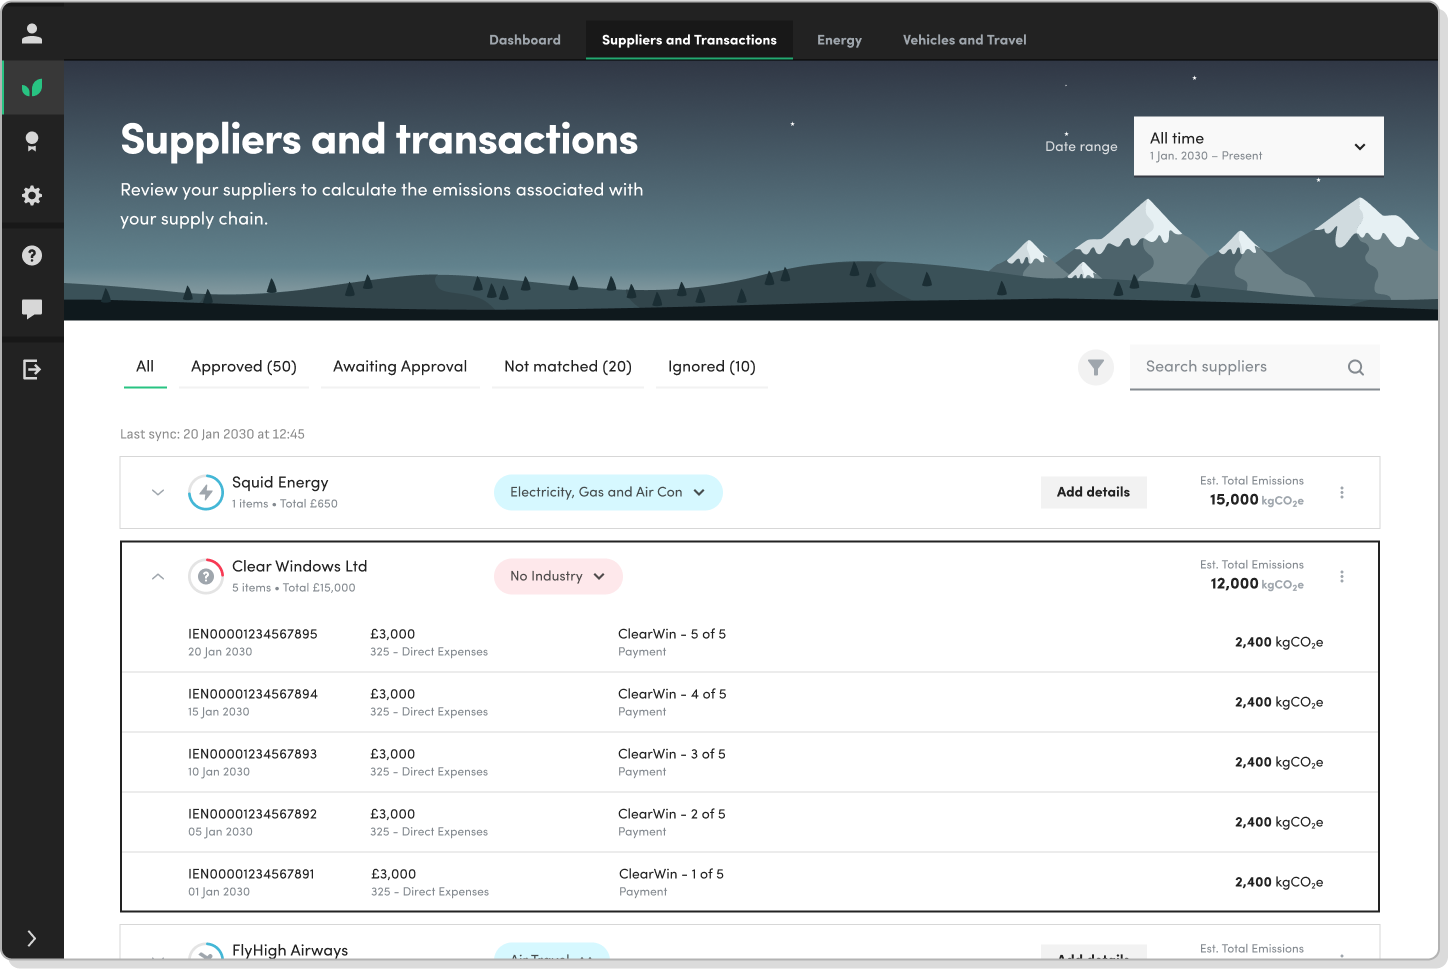
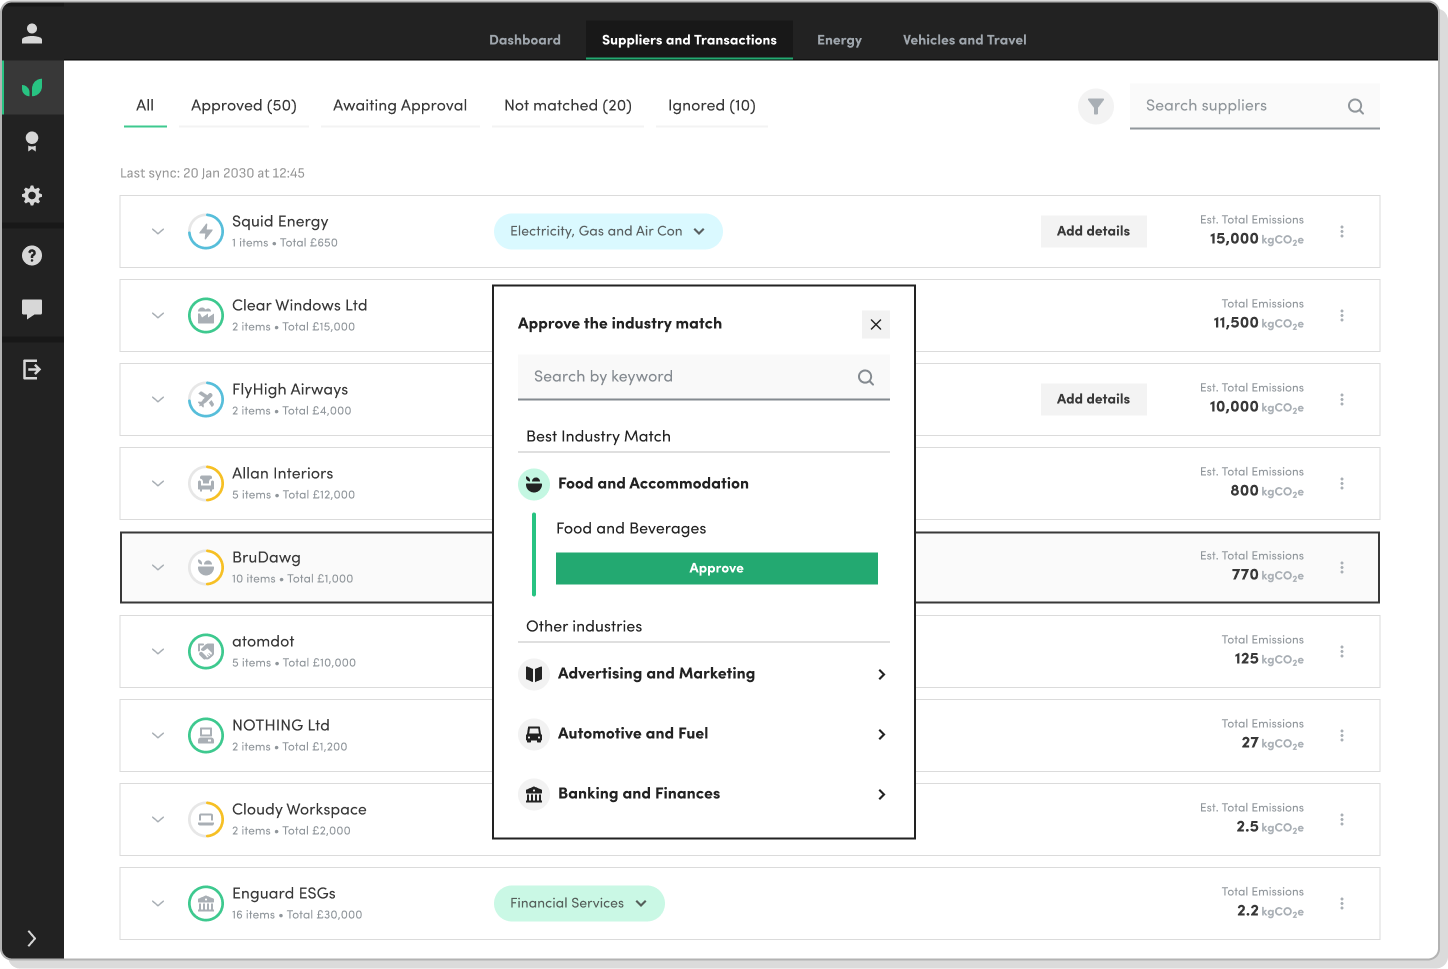
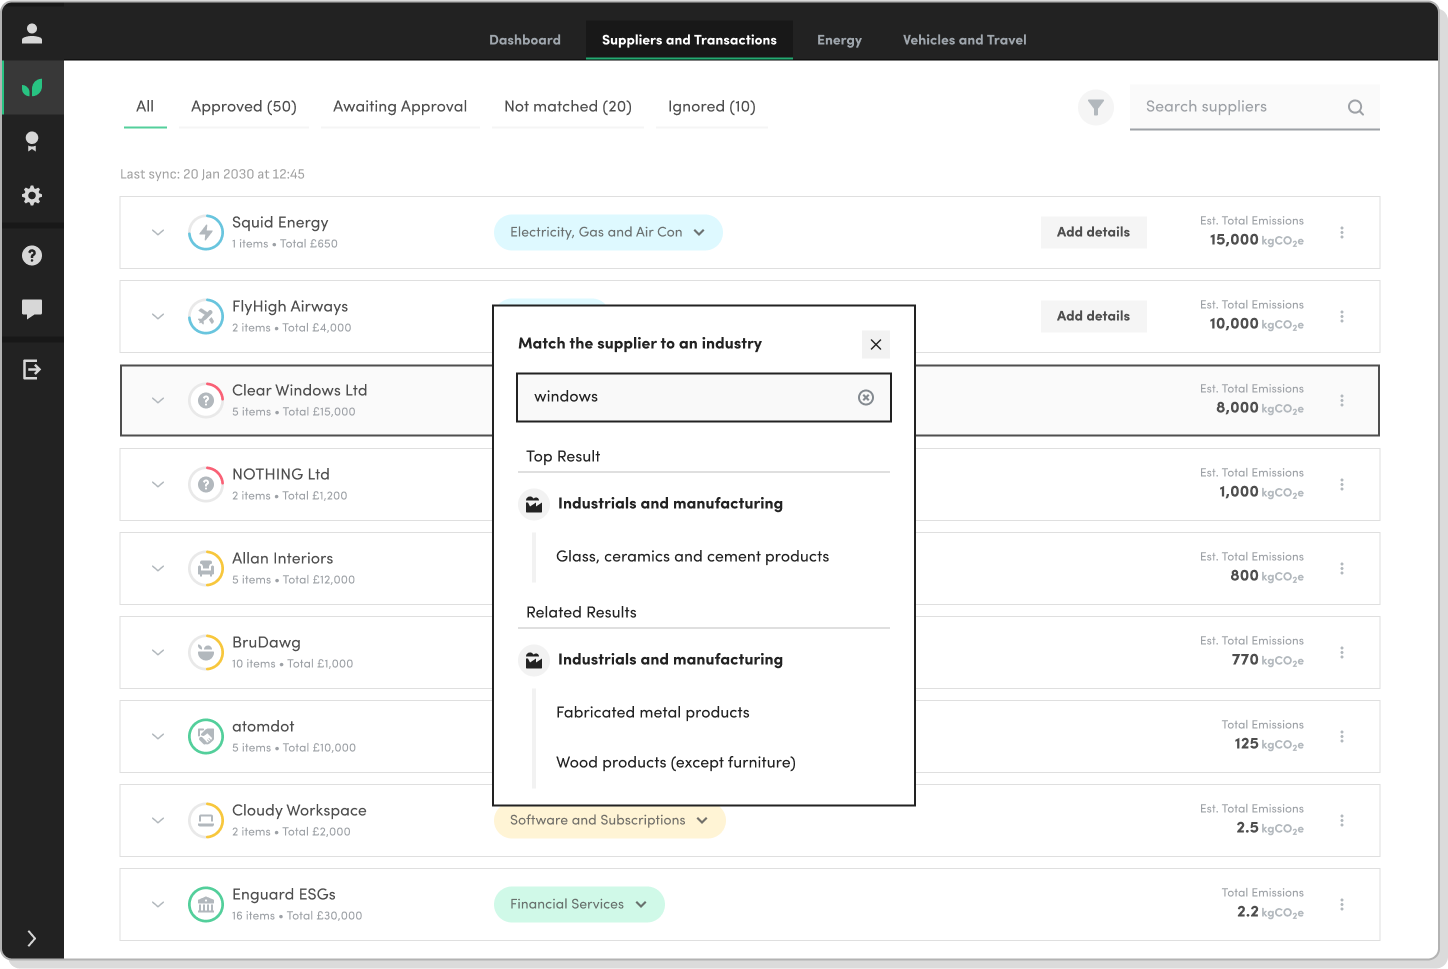
Examples of final UI from the ‘Suppliers & Transactions' section.
⦿ Select an image to zoom in.
Calculating energy emissions
Energy is one of the main contributors to a business’ total footprint.
In this instance, users can provide their actual energy consumption to receive an accurate calculation.
※ Design Challenges
Providing flexible mechanics to enter consumption to cater for all types of energy billing.
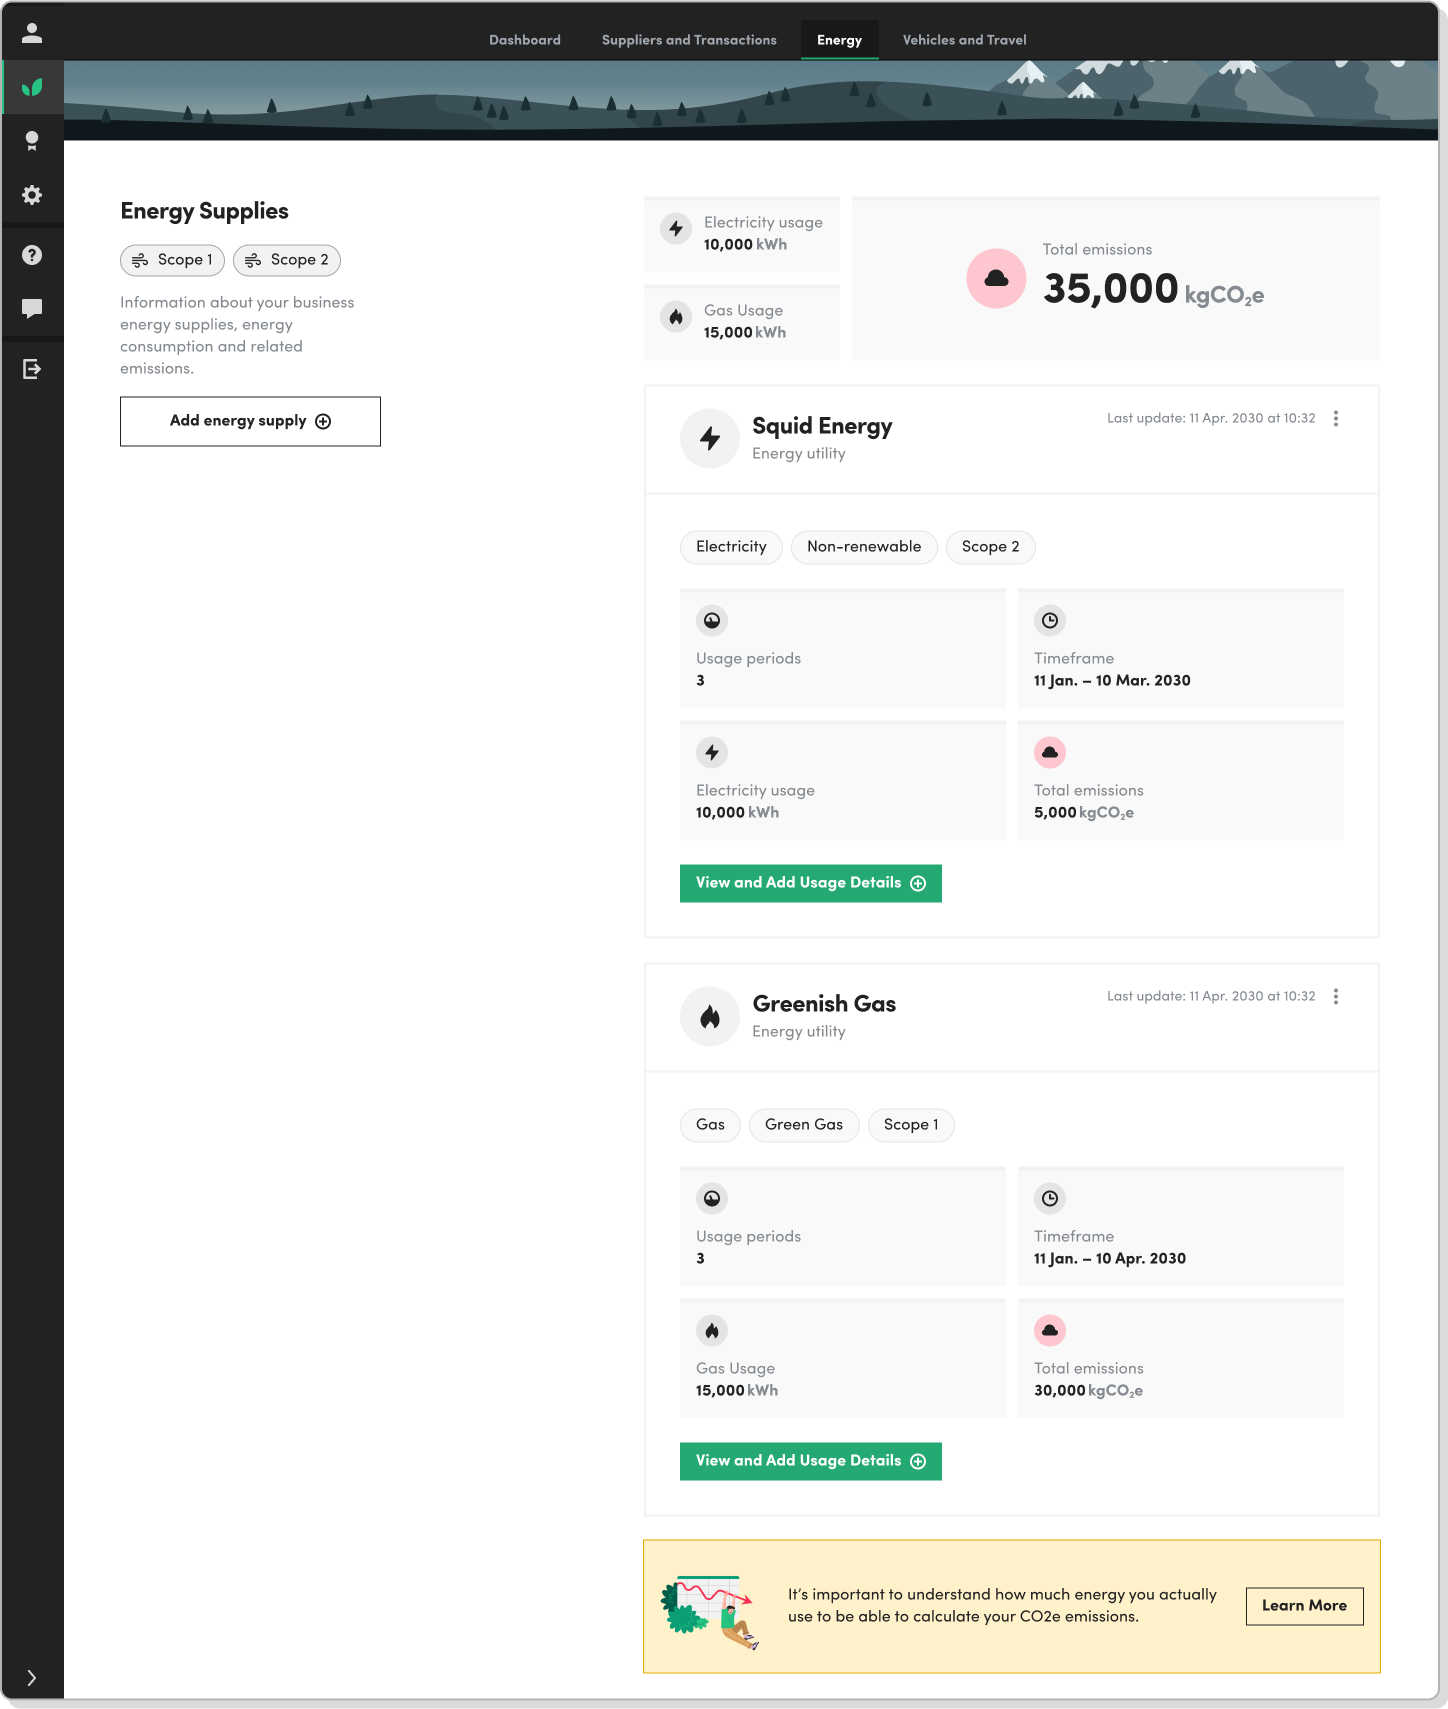
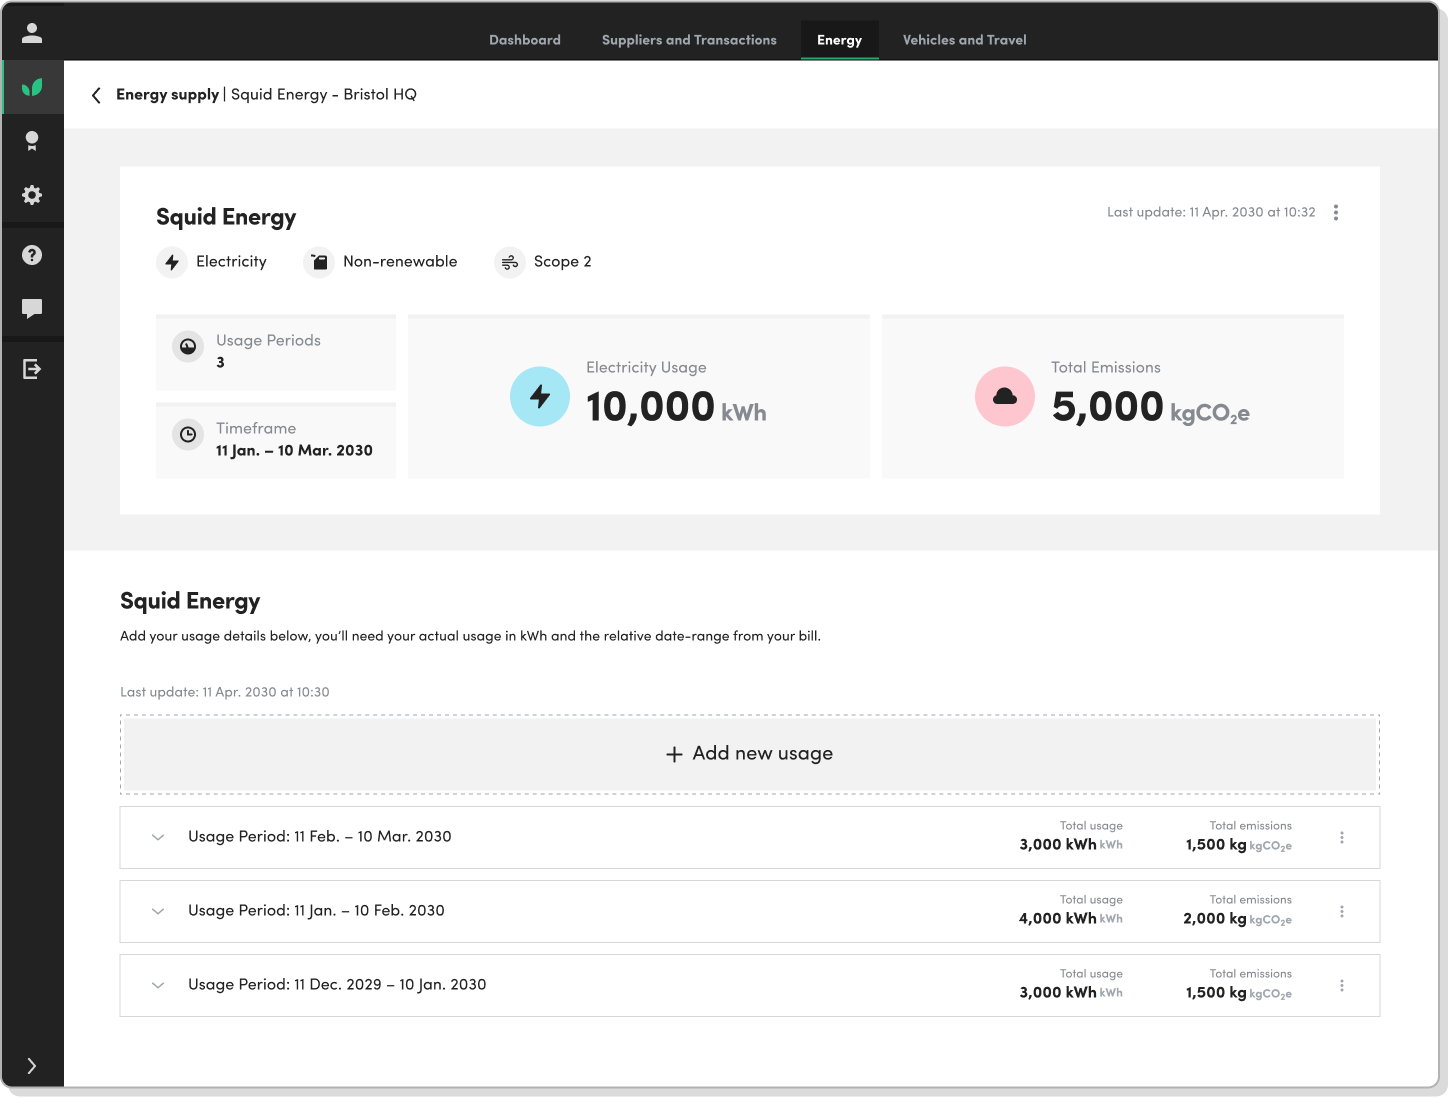
Examples of final UI from the ‘Energy' section.
⦿ Select an image to zoom in.
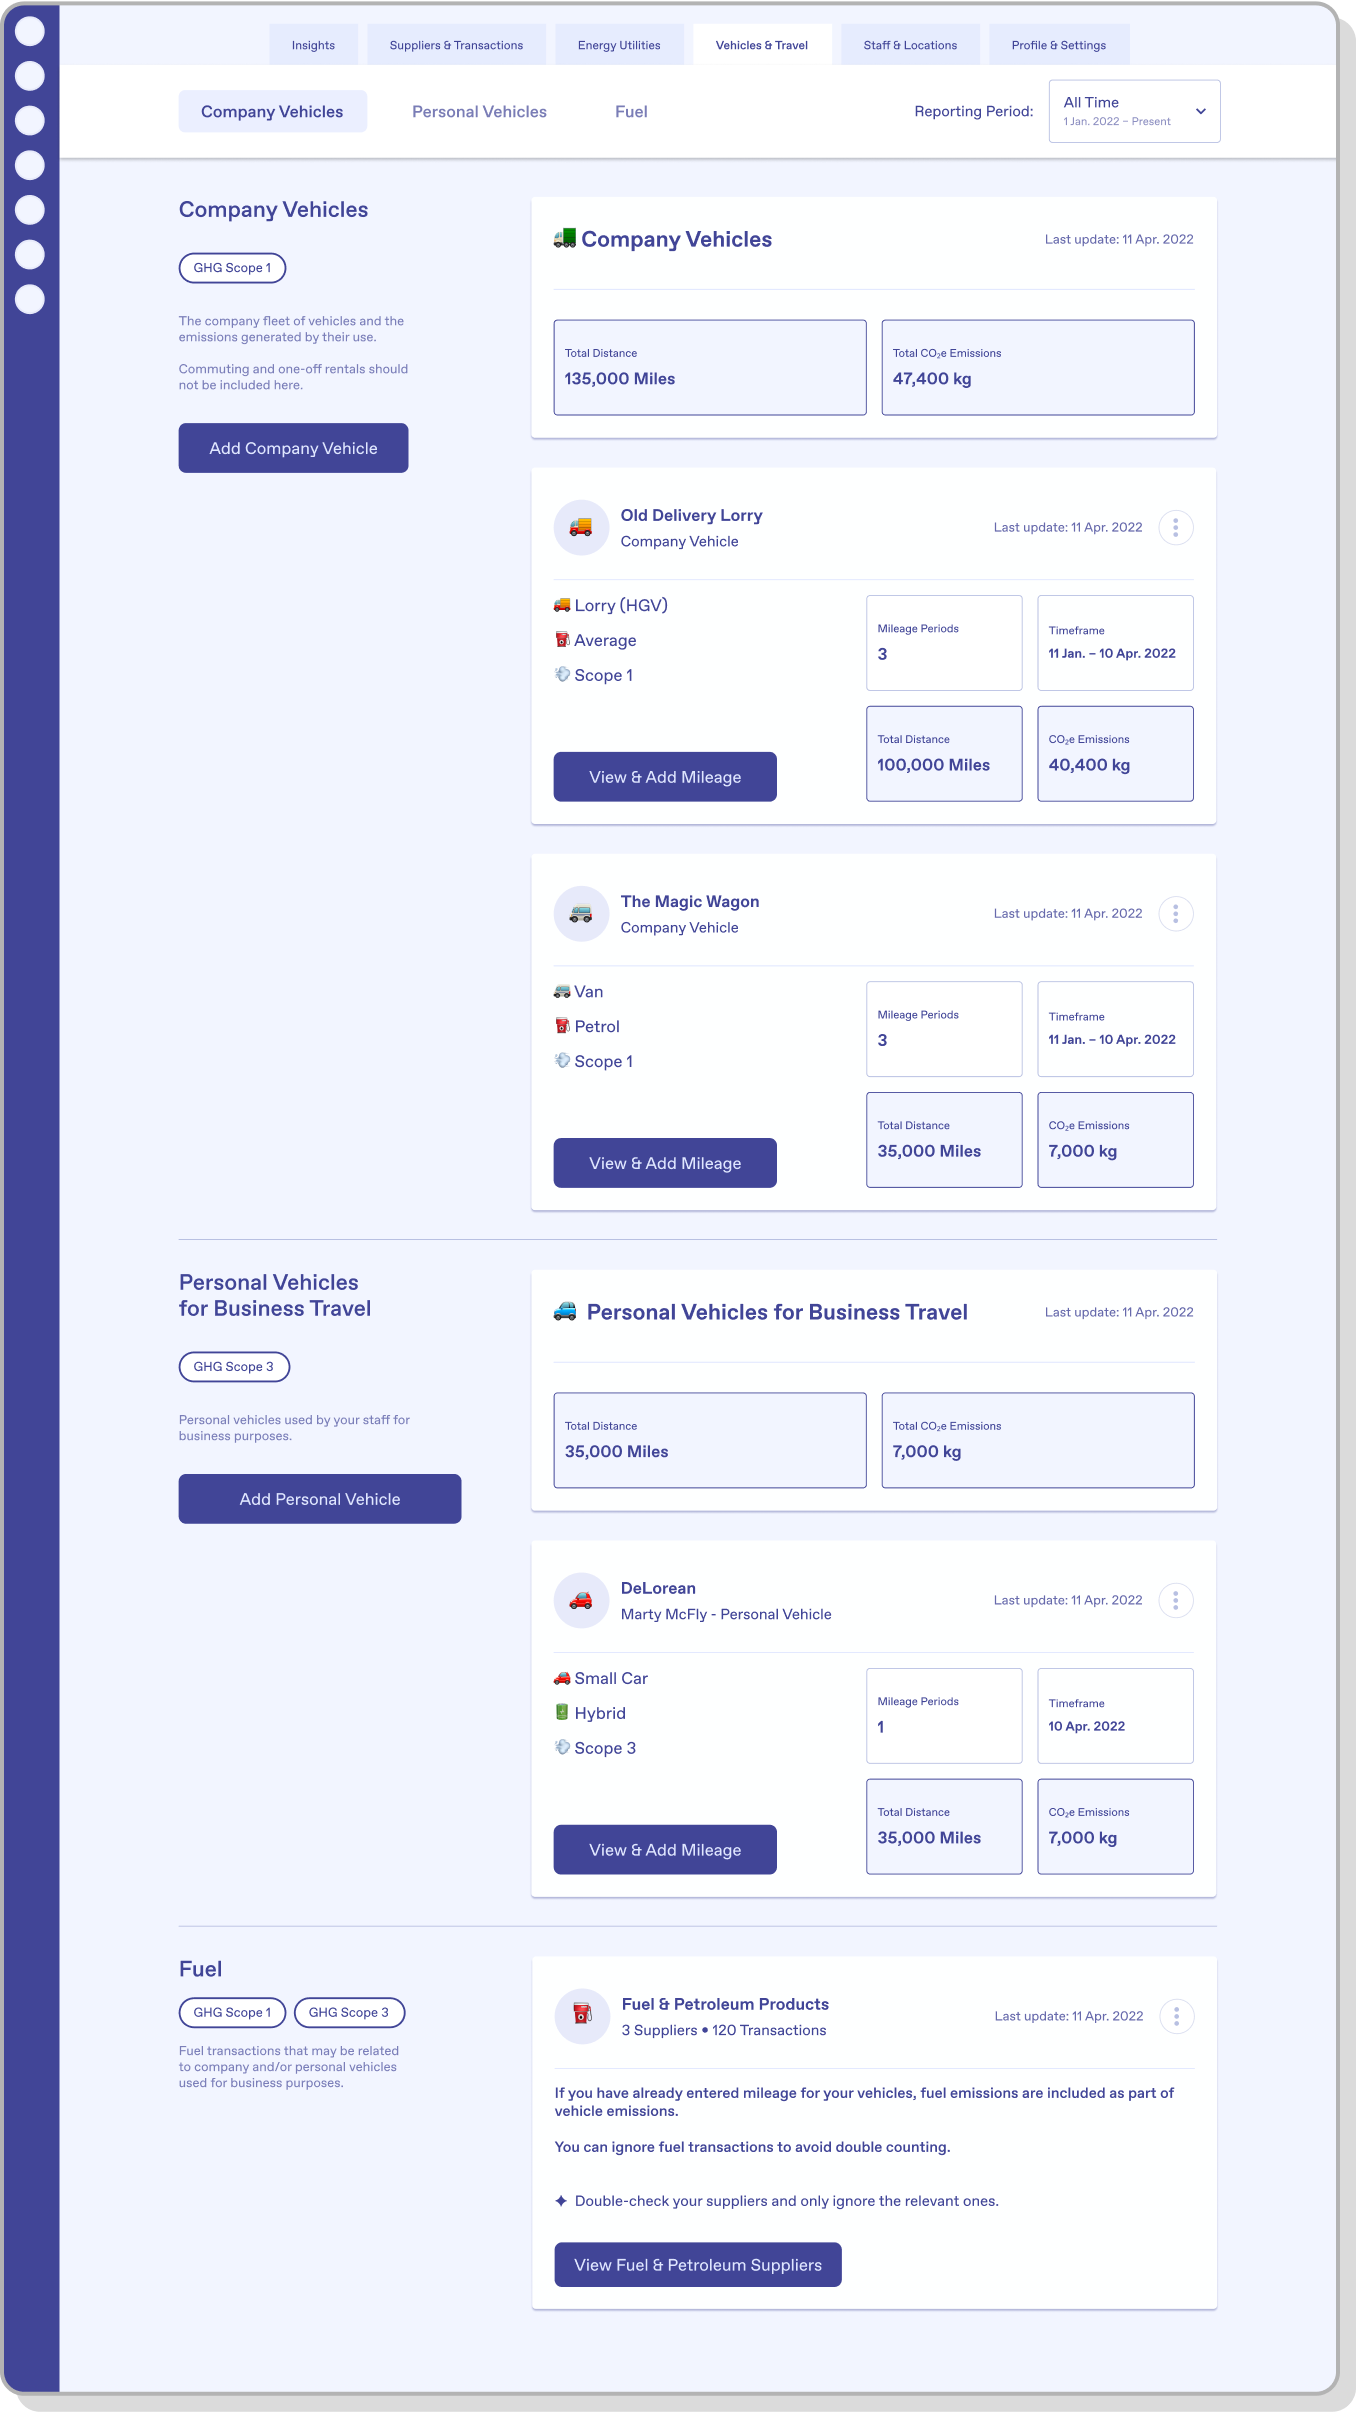
Calculating mileage
Business vehicles and travel are another substantial source of carbon emissions.
Similarly to energy, we created a flexible interface to enter mileage for company vehicles.
Air and rail travel were also explored as a post-Beta feature.
※ Design Challenges
Allowing flexibility in how different vehicles are tracked and updated over time.
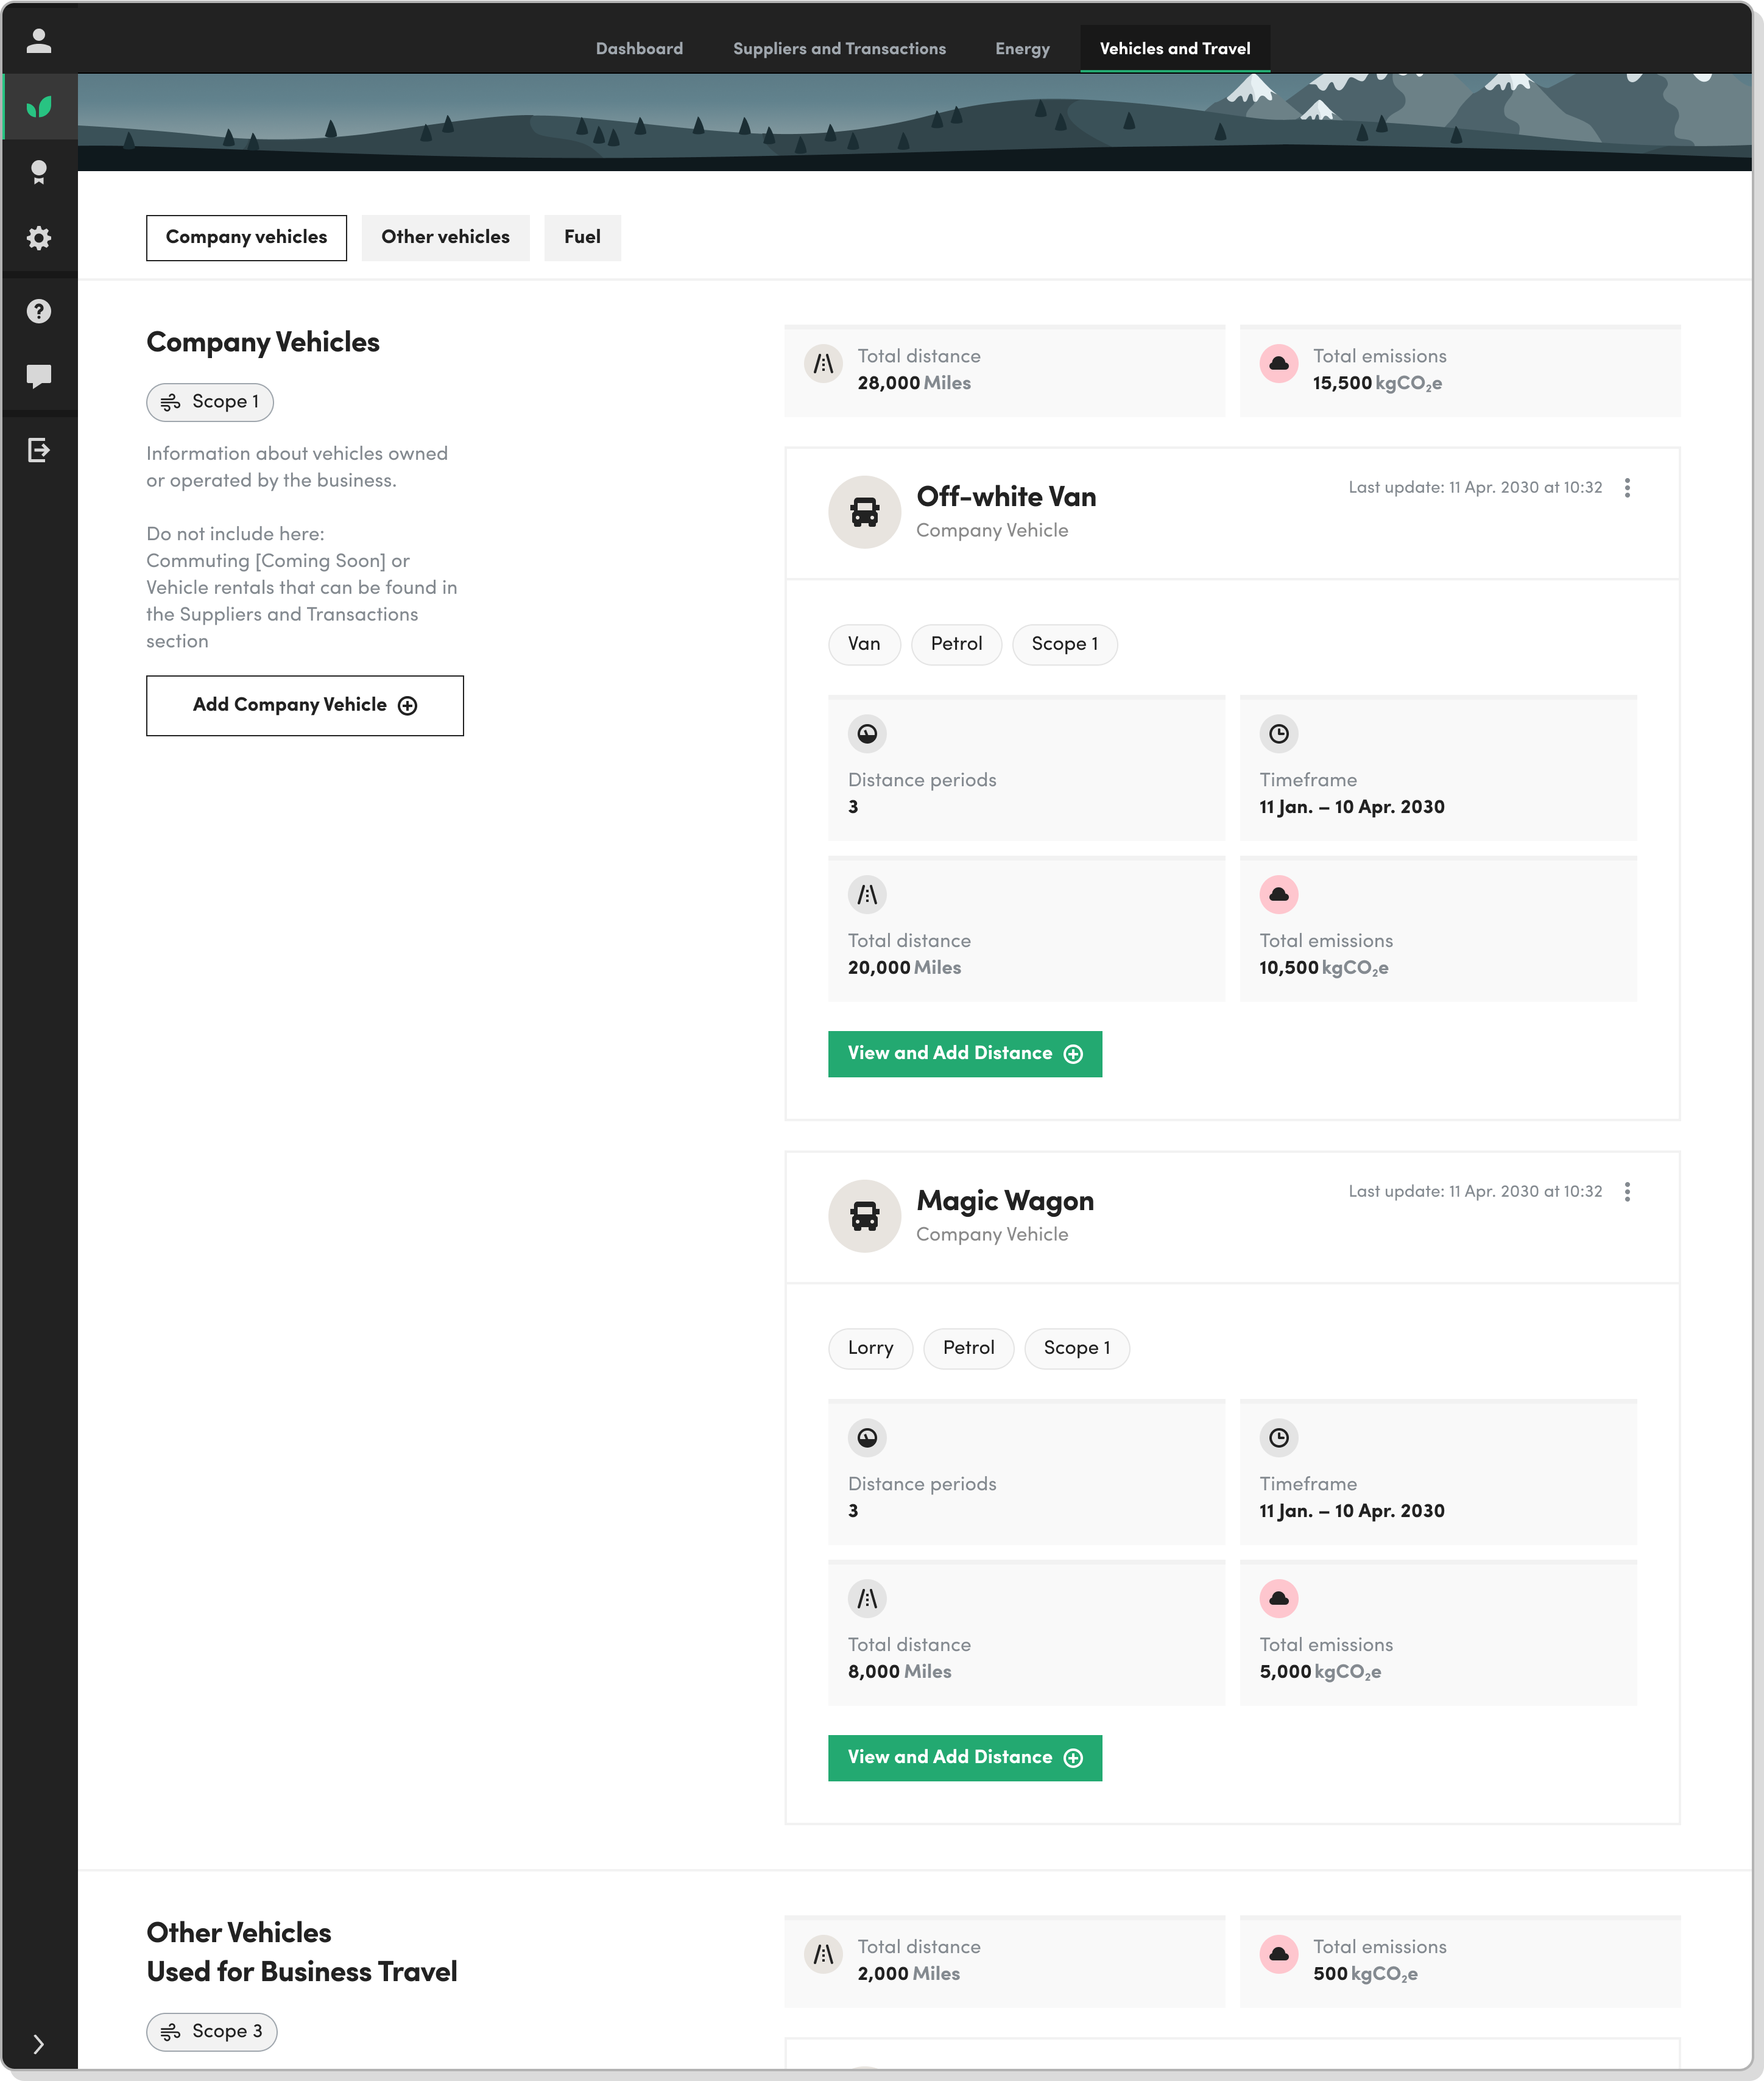
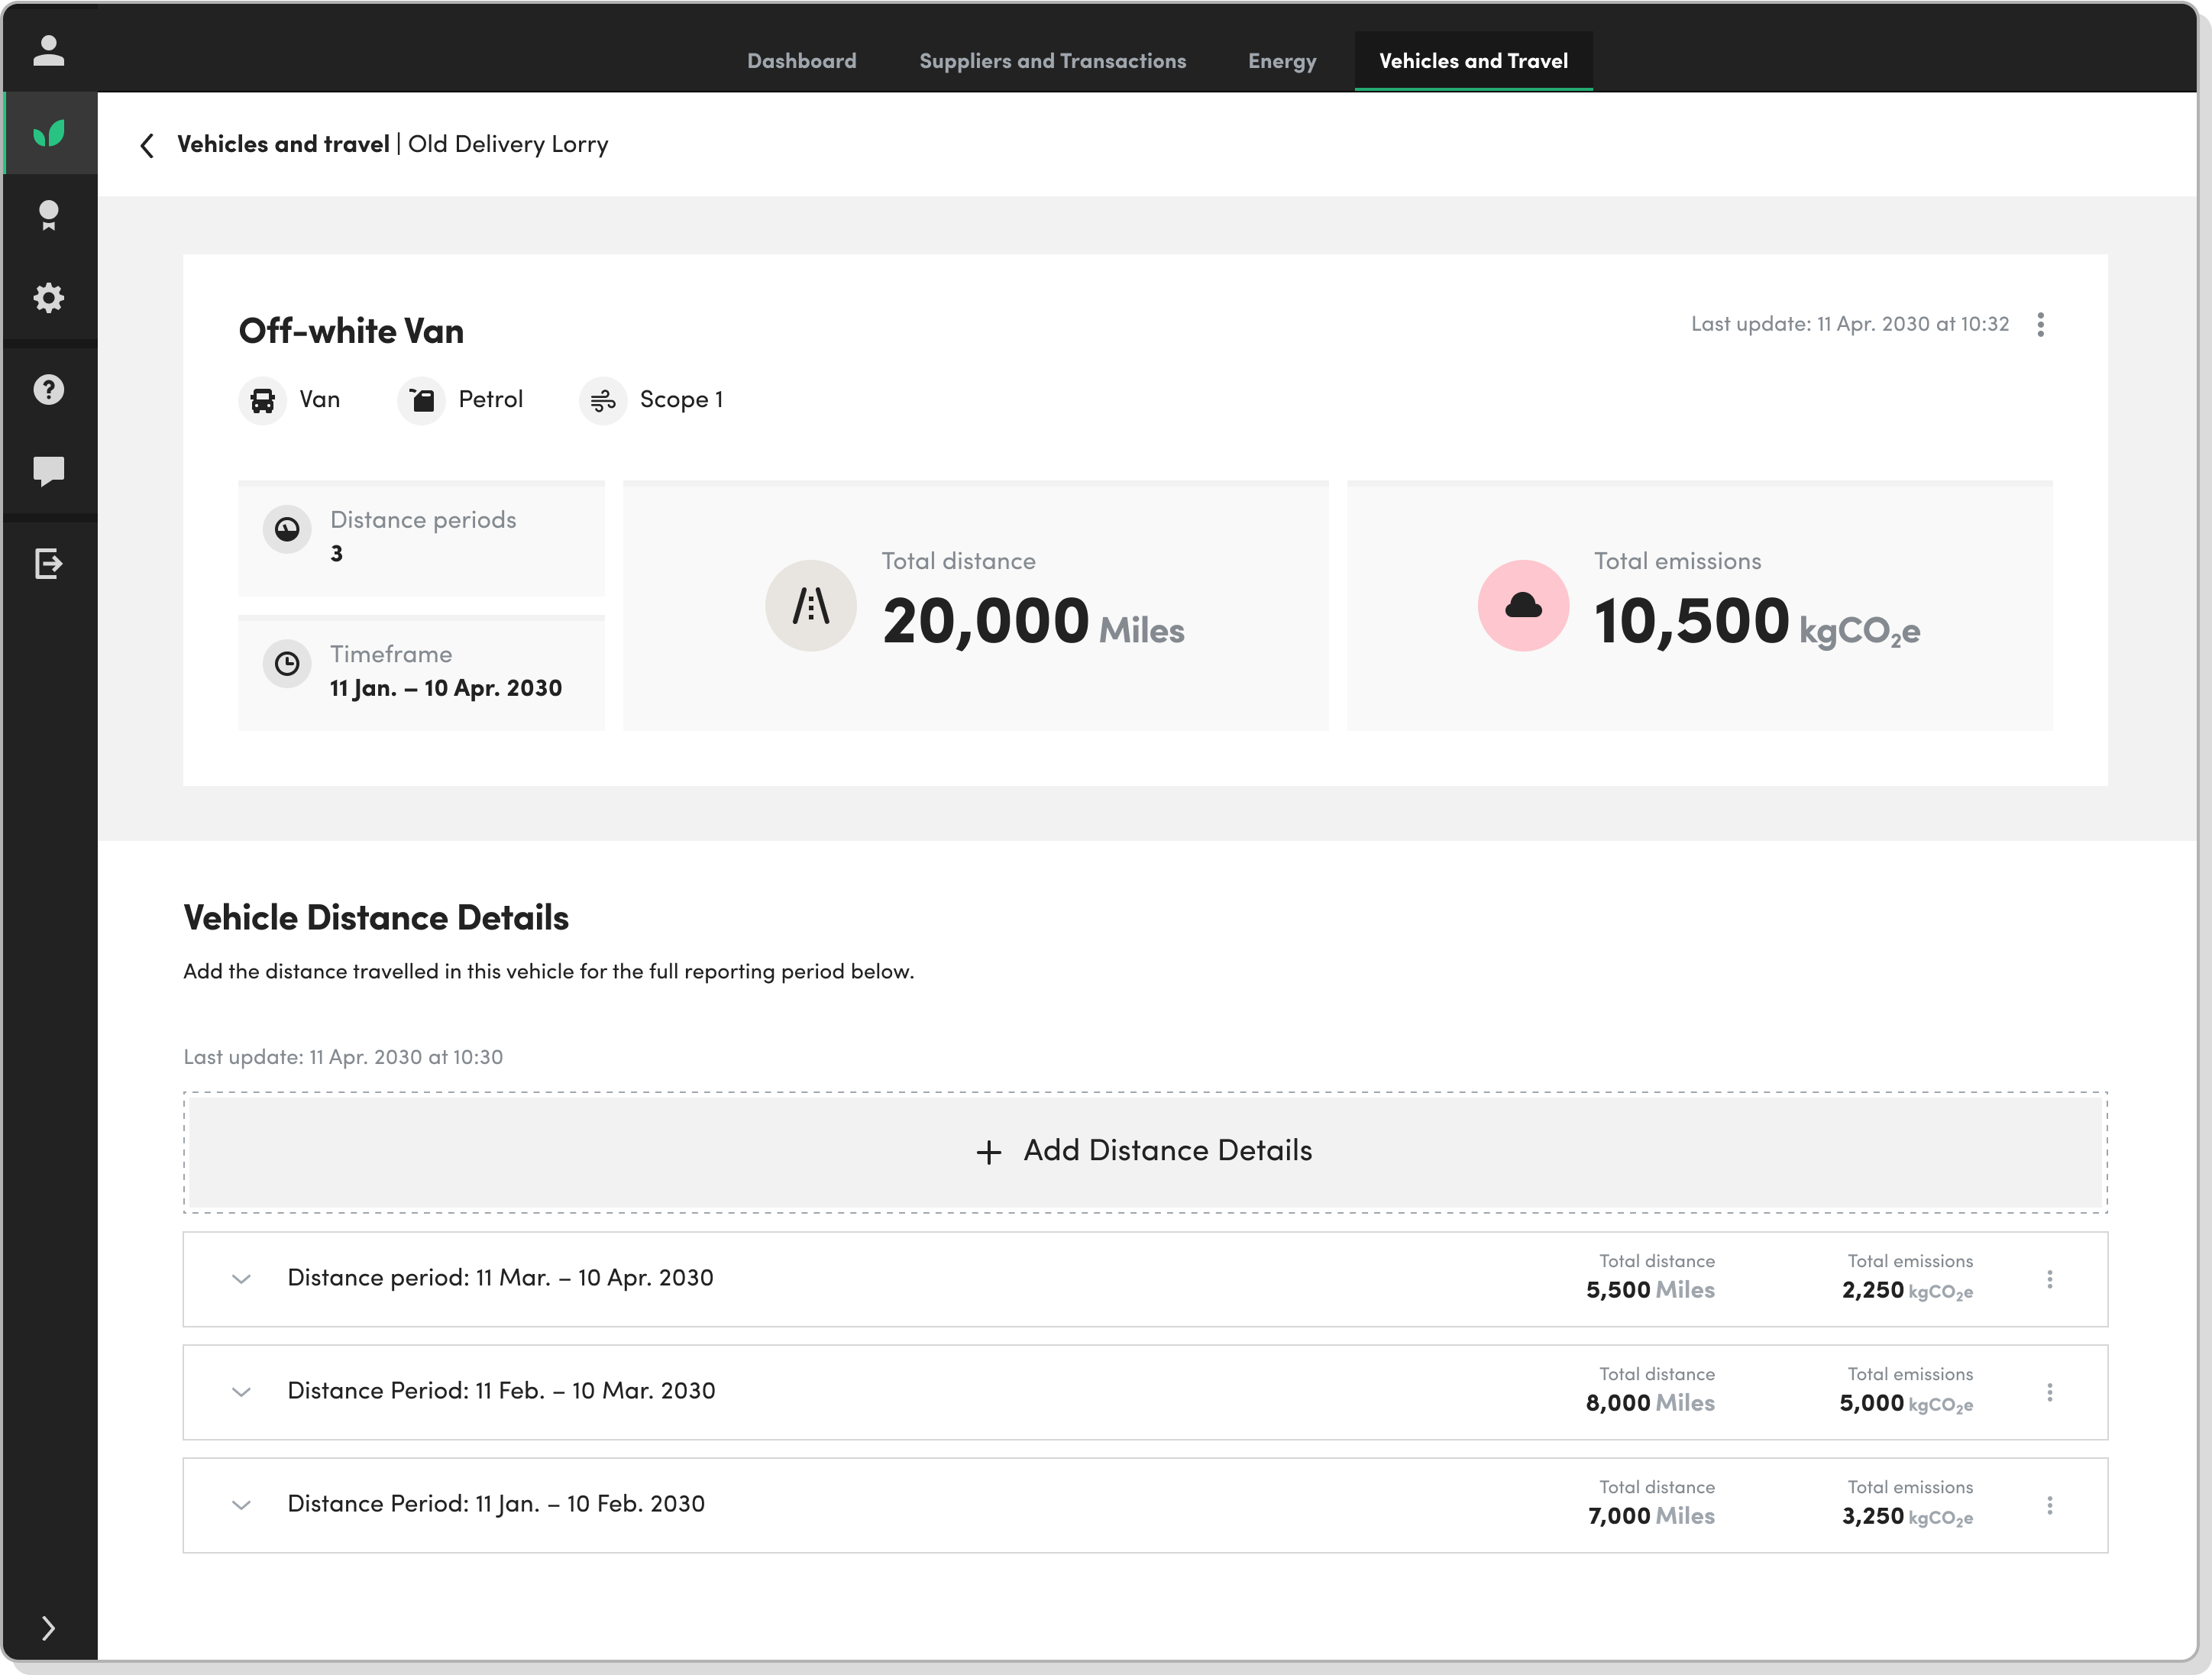
Examples of final UI from the ‘Vehicles & Travel' section.
⦿ Select an image to zoom in.
Summing it all up
A simplified dashboard was created to focus on the emission metrics available for Beta.
More advanced iterations were explored for following releases.
※ Design Challenges
Displaying the key metrics without overwhelming users with data.
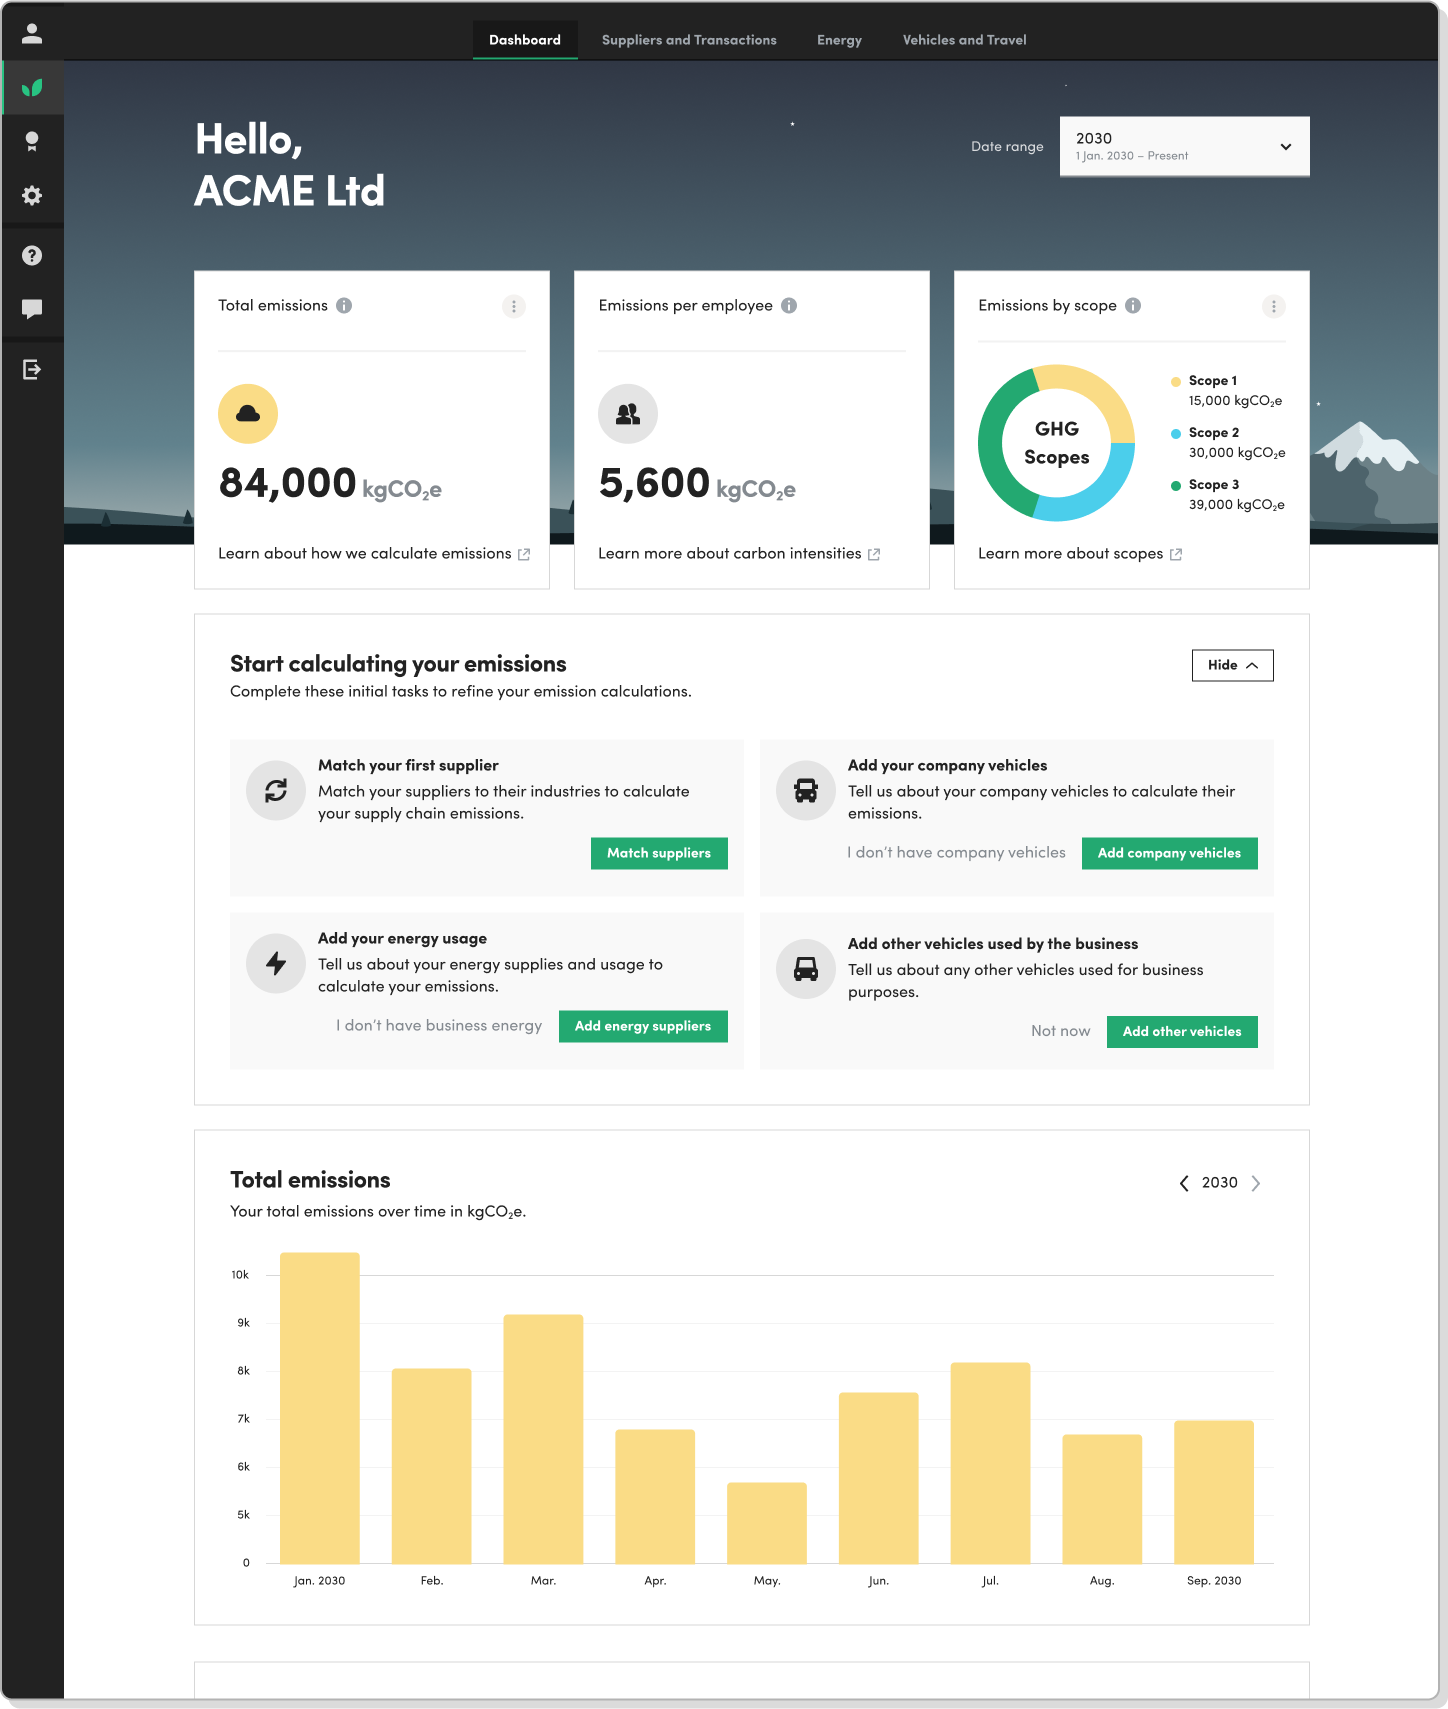
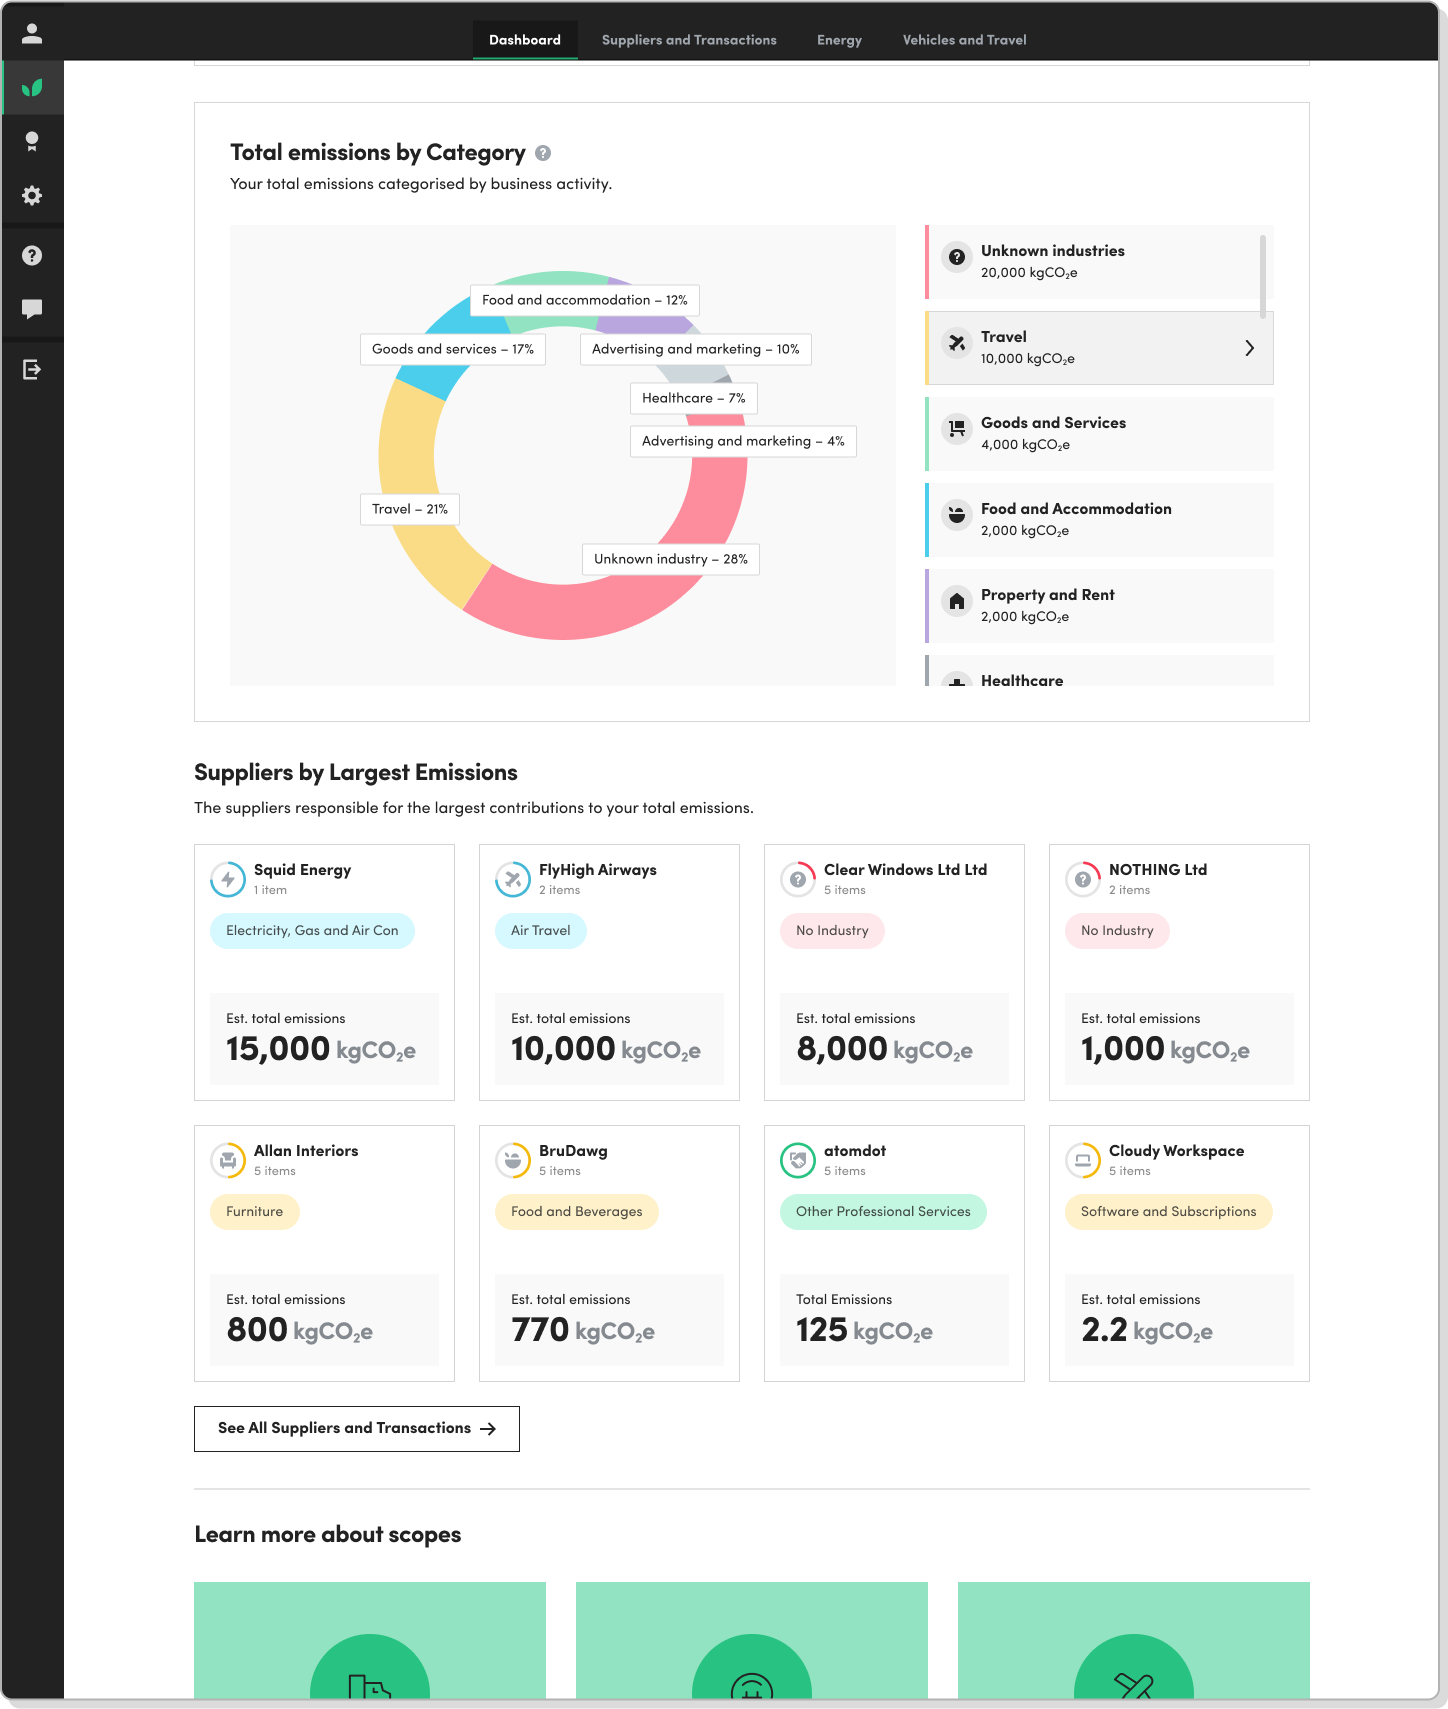
Examples of final UI from the ‘Dashboard' section..
⦿ Select an image to zoom in.
Shoutouts.
Shaylin Wilkins (User Research)
Emrah Kara (Design System)
✶
Ecologi is a registered trademark of Ecologi Action Ltd.
❥ Like what you see?
a•tomdot
Tommaso Guidotti © 2026
